

Mathematics, 12.10.2019 02:30, AysiaRamosLee
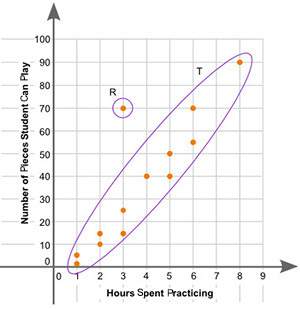
The scatter plot shows the relationship between the number of hours spent practicing piano per week and the number of pieces of music the student can play:
part a: what is the group of points labeled t called? what is the point labeled r called? give a possible reason for the presence of point r.
part b: describe the association between the number of hours practiced each week and the number of pieces a piano student can play.

Answers: 2


Other questions on the subject: Mathematics
Mathematics, 21.06.2019 20:00, anthonybowie99
Write the point-slope form of the line passing through (2, -12) and parallel to y=3x.
Answers: 3
Do you know the correct answer?
The scatter plot shows the relationship between the number of hours spent practicing piano per week...
Questions in other subjects:
Mathematics, 22.08.2019 14:00


Health, 22.08.2019 14:00
Mathematics, 22.08.2019 14:00

Mathematics, 22.08.2019 14:00

Chemistry, 22.08.2019 14:00
Mathematics, 22.08.2019 14:00


English, 22.08.2019 14:00


