

Mathematics, 26.07.2019 00:00, maddy6882
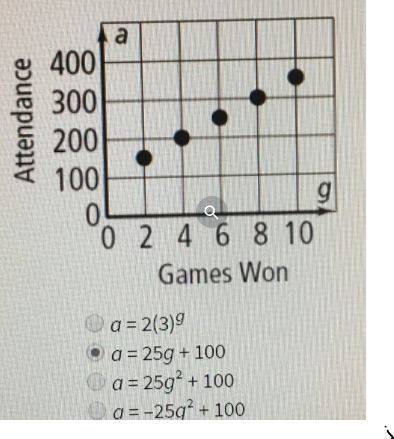
The attendances at the high school basketball games seems to be affected by the success of the team. the graph below models the attendance over the first half of the season. which function would also represent the data shown in the graph below where a represents the attendance and g represents the number of games the team has won? there is a graph with it, but i don't seem to be able to attach it!

Answers: 1


Other questions on the subject: Mathematics
Mathematics, 21.06.2019 18:00, bvaughn6477
Clara schumann is buying bagels for her coworkers, she buys a dozen bagels priced at $5.49 a dozen. the bakery's cost for making the bagels is $2.25 per dozen. what is the markup rate based on selling price on a dozen bagels?
Answers: 1
Mathematics, 21.06.2019 22:10, Jenifermorales101
Write the function for the graph. (1.8) (0,4)
Answers: 3
Mathematics, 22.06.2019 02:30, Gearyjames8
What is the equation of the parabola with focus (-1,-1) and directrix y=1?
Answers: 1
Do you know the correct answer?
The attendances at the high school basketball games seems to be affected by the success of the team....
Questions in other subjects:


Mathematics, 05.09.2020 06:01

History, 05.09.2020 06:01


