

Mathematics, 27.07.2019 02:30, corrah15
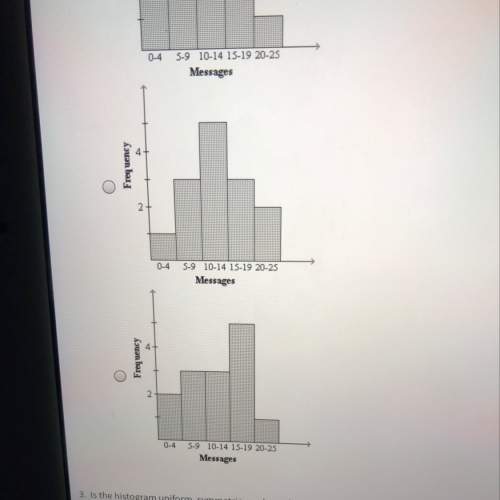
The data below shows the average of text messages a group of students sends per day. which histogram could represent the data?

Answers: 1


Other questions on the subject: Mathematics
Mathematics, 21.06.2019 12:30, giulianna41
Which of the following could be the graph of the equation y = -2x + 5
Answers: 2
Mathematics, 21.06.2019 19:20, ayeofaygo5168
The fraction of defective integrated circuits produced in a photolithography process is being studied. a random sample of 300 circuits is tested, revealing 17 defectives. (a) calculate a 95% two-sided confidence interval on the fraction of defective circuits produced by this particular tool. round the answers to 4 decimal places. less-than-or-equal-to p less-than-or-equal-to (b) calculate a 95% upper confidence bound on the fraction of defective circuits. round the answer to 4 decimal places. p less-than-or-equal-to
Answers: 3
Mathematics, 21.06.2019 21:30, myhomeacc32
Acoffee shop orders at most $3,500 worth of coffee and tea. the shop needs to make a profit of at least $1,900 on the order. the possible combinations of coffee and tea for this order are given by this system of inequalities, where c = pounds of coffee and t = pounds of tea: 6c + 13t ≤ 3,500 3.50c + 4t ≥ 1,900 which graph's shaded region represents the possible combinations of coffee and tea for this order?
Answers: 1
Do you know the correct answer?
The data below shows the average of text messages a group of students sends per day. which histogram...
Questions in other subjects:
Mathematics, 03.01.2022 06:10
Mathematics, 03.01.2022 06:10

Biology, 03.01.2022 06:10
Mathematics, 03.01.2022 06:10
Mathematics, 03.01.2022 06:10


