


The graph below shows the solution to a system of inequalities
which of the following inequalit...

Mathematics, 12.11.2019 19:31, Geo777
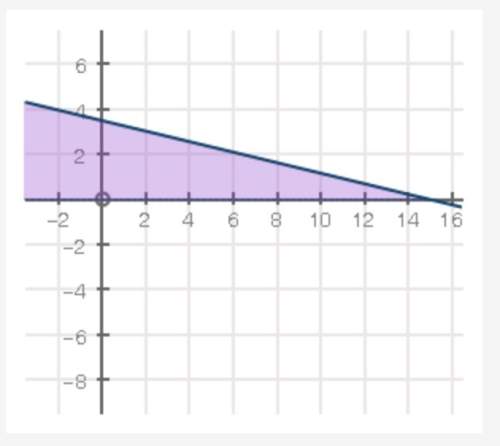
The graph below shows the solution to a system of inequalities
which of the following inequalities is modeled by the graph?
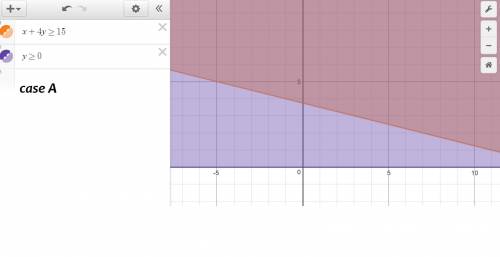
a. x + 4y ≥ 15; y ≥ 0
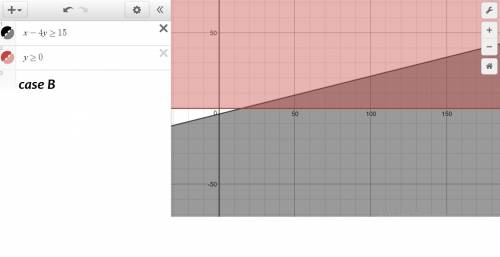
b. x − 4y ≥ 15; y ≥ 0
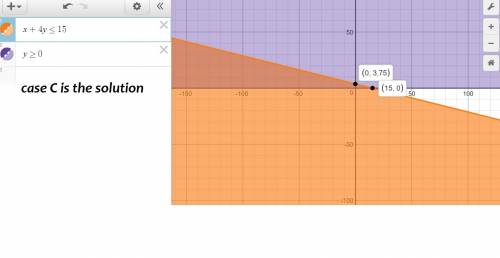
c. x + 4y ≤ 15; y ≥ 0
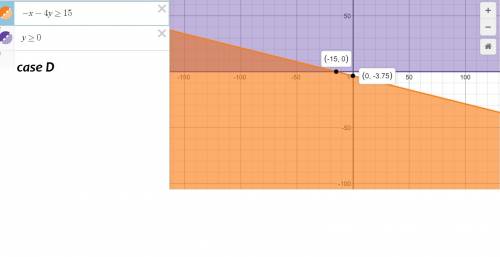
d.−x − 4y ≥ 15; y ≥ 0

Answers: 2
Other questions on the subject: Mathematics
Mathematics, 21.06.2019 13:30, 19colemankl
The number of pages in the u. s. tax code exceeds the number of pages in the king james bible by 18,528. the combined number of pages in the tax code and the bible is 21,472
Answers: 2
Do you know the correct answer?
Questions in other subjects:

Spanish, 03.09.2021 01:00
Mathematics, 03.09.2021 01:00

English, 03.09.2021 01:00

History, 03.09.2021 01:00

Computers and Technology, 03.09.2021 01:00
Mathematics, 03.09.2021 01:00

Business, 03.09.2021 01:00


