


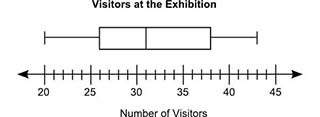
Abox plot is shown below:
what is the median and q1 of the data set represented on the...

Mathematics, 13.10.2019 04:10, ThetPerson
Abox plot is shown below:
what is the median and q1 of the data set represented on the plot?
median = 31; q1 = 26
median = 30; q1 = 26
median = 31; q1 = 20
median = 30; q1 = 20

Answers: 1
Other questions on the subject: Mathematics
Mathematics, 21.06.2019 21:00, kharmaculpepper
Joanie watched 1 out of three of a movie in the morning
Answers: 1
Mathematics, 21.06.2019 21:30, BakerElsie02
Joe has a rectangular chicken coop. the length of the coop is 4 feet less than twice the width. the area of the chicken coop is 510 square feet. what is the length of the chicken coup?
Answers: 3
Mathematics, 21.06.2019 22:00, taliyahjhonson1
The birth weights of newborn babies in the unites states follow in a normal distrubution with a mean of 3.4 kg and standard deviation of 0.6 kg. reaserches interested in studying how. children gain weights decide to take random samples of 100 newborn babies and calculate the sample mean birth weights for each sample
Answers: 1
Mathematics, 22.06.2019 00:00, victorialeona81
Find the root(s) of f (x) = (x- 6)2(x + 2)2.
Answers: 1
Do you know the correct answer?
Questions in other subjects:
Mathematics, 20.10.2020 05:01

History, 20.10.2020 05:01

Medicine, 20.10.2020 05:01
Mathematics, 20.10.2020 05:01

Law, 20.10.2020 05:01


