


Two cars start at the same time and travel at different constant rates. a graph for
car a pas...

Mathematics, 23.08.2019 09:00, elizzabel1944
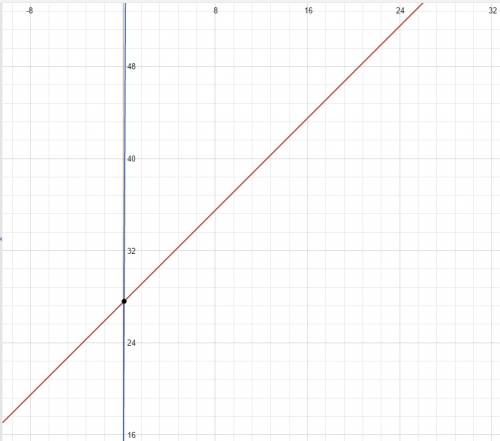
Two cars start at the same time and travel at different constant rates. a graph for
car a passes through the point (0.5, 27.5), and a graph for car b passes through (4,240). both graphs show distance in miles and time in hours. which car is traveling faster?

Answers: 1
Other questions on the subject: Mathematics
Mathematics, 21.06.2019 18:30, viktoria1198zz
Florence price's brownies and more sells all types of cookies and pastries. on tuesdays, they markdown all brownies 75% to a sale of $1.50 a dozen. find the selling price and the markdown of a dozen brownies.
Answers: 1
Mathematics, 21.06.2019 22:30, jcazares3558
Abag contains 10 white golf balls and 6 striped golf balls. a golfer wants to add 112 golf balls to the bag. he wants the ratio of white to striped gold balls to remain the same. how many of each should he add?
Answers: 2
Mathematics, 22.06.2019 00:30, alimfelipe
Determine if the outside temperature is a function of the time of day or if the time of day is a function of temperature and explain why or why not.
Answers: 3
Mathematics, 22.06.2019 01:00, s27511583
The weight of 46 new patients of a clinic from the year 2018 are recorded and listed below. construct a frequency distribution, using 7 classes. then, draw a histogram, a frequency polygon, and an ogive for the data, using the relative information from the frequency table for each of the graphs. describe the shape of the histogram. data set: 130 192 145 97 100 122 210 132 107 95 210 128 193 208 118 196 130 178 187 240 90 126 98 194 115 212 110 225 187 133 220 218 110 104 201 120 183 124 261 270 108 160 203 210 191 180 1) complete the frequency distribution table below (add as many rows as needed): - class limits - class boundaries - midpoint - frequency - cumulative frequency 2) histogram 3) frequency polygon 4) ogive
Answers: 1
Do you know the correct answer?
Questions in other subjects:


Health, 09.04.2021 02:00

Mathematics, 09.04.2021 02:00


