


Me pl
the scatter plot below shows the number of pizzas sold during weeks when differen...

Mathematics, 26.09.2019 14:30, phillipmccormick
Me pl
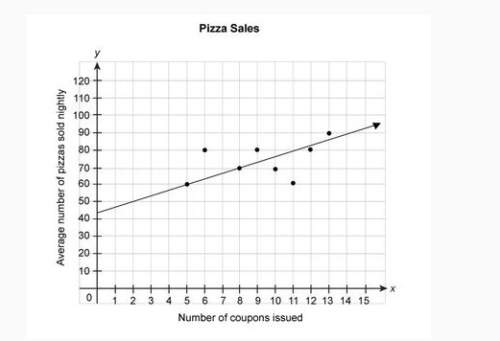
the scatter plot below shows the number of pizzas sold during weeks when different numbers of coupons were issued. the equation represents the linear model for this data. y = 3.4x + 43
according to the model, what is the average number of pizzas sold in one night if no coupons are issued?
question 5 options:
a 43
b 0
c 11
d 21

Answers: 2
Other questions on the subject: Mathematics
Mathematics, 21.06.2019 17:00, nicolemaefahey
Need this asap if anyone can i would be very grateful. if you could show workings that would really
Answers: 1
Mathematics, 22.06.2019 00:00, kklove6700
Which of the following is the maximum value of the equation y=-x^2+2x+5 a. 5 b. 6 c. 2. d. 1
Answers: 1
Mathematics, 22.06.2019 02:30, destiny465
Why does the shape of the distribution of the weights of russet potatoes tend to be symmetrical?
Answers: 3
Do you know the correct answer?
Questions in other subjects:

Physics, 27.10.2020 16:50


Mathematics, 27.10.2020 16:50
Mathematics, 27.10.2020 16:50
Mathematics, 27.10.2020 16:50


