


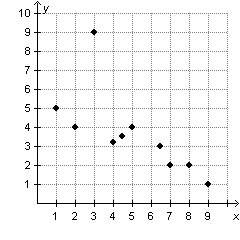
The scatterplot below shows a set of data points.
which point would be considered an outlier?...

Mathematics, 26.01.2020 21:31, chrissyg76
The scatterplot below shows a set of data points.
which point would be considered an outlier?
(1, 5)
(3, 9)
(5, 4)
(9, 1)

Answers: 3
Other questions on the subject: Mathematics
Mathematics, 22.06.2019 00:00, Naomi7021
Which is a logical conclusion based on the given information? a. figure abcd is a rhombus by the definition of a rhombus. b. segment ac is congruent to segment dc by cpctc. c. angle acb is congruent to angle adc by the angle-side-angle theorem. d. triangle acd is congruent to triangle cab by the hypotenuse-leg theorem.
Answers: 1
Mathematics, 22.06.2019 01:30, hela9astrid
This graph shows a portion of an odd function. use the graph to complete the table of values. x f(x) −2 −3 −4 −6 im sorry i cant get the graph up
Answers: 1
Do you know the correct answer?
Questions in other subjects:


Social Studies, 30.01.2020 02:47

Biology, 30.01.2020 02:47
Mathematics, 30.01.2020 02:47


