


The graph shown is the solution set for which of the following inequalities?
y ≥ x + 1
...

Mathematics, 29.09.2019 11:00, evy22
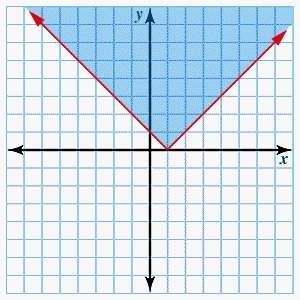
The graph shown is the solution set for which of the following inequalities?
y ≥ x + 1
y ≥ |x| + 1
y ≥ |x - 1|

Answers: 1
Other questions on the subject: Mathematics
Mathematics, 22.06.2019 00:00, minecraftsam2018
What is the effect on the graph of the function f(x) = x2 when f(x) is changed to f(x) − 4?
Answers: 1
Do you know the correct answer?
Questions in other subjects:


Social Studies, 14.12.2021 08:30
History, 14.12.2021 08:30

Engineering, 14.12.2021 08:30

Spanish, 14.12.2021 08:30

English, 14.12.2021 08:30
English, 14.12.2021 08:30


