

Mathematics, 10.10.2019 13:30, jessnolonger
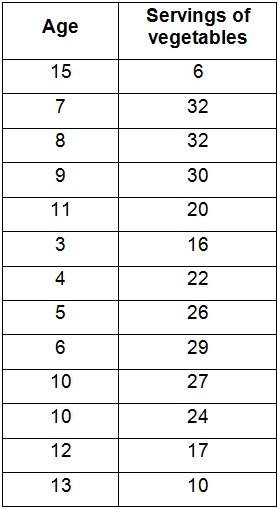
The table shows children’s ages and the number of servings of vegetables the children ate each week.
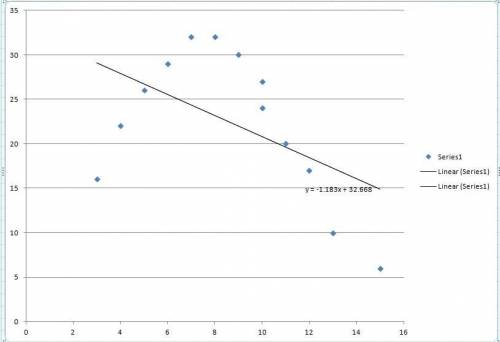
(a) create a scatter plot of the data.
(b) do the points appear to follow a linear pattern? if so, is the correlation positive or negative?

Answers: 3


Other questions on the subject: Mathematics
Mathematics, 21.06.2019 18:30, bvaughn4152
The height of a flare fired from the deck of a ship in distress can be modeled by h(t)= -2(8t^2-52t-28), where h is the height of the flare above water and t is the time in seconds. a. find the time it takes the flare to hit the water.
Answers: 1
Mathematics, 22.06.2019 01:30, heidiallen565
Arace is 10 kilometers long. markers will be placed at the beginning and end of the race course and at each 500 meter mark. how many markers are needed to mark the course for the race?
Answers: 3
Do you know the correct answer?
The table shows children’s ages and the number of servings of vegetables the children ate each week....
Questions in other subjects:

English, 09.07.2019 20:30

English, 09.07.2019 20:30
Mathematics, 09.07.2019 20:30


