

Mathematics, 04.08.2019 18:50, puchie1225
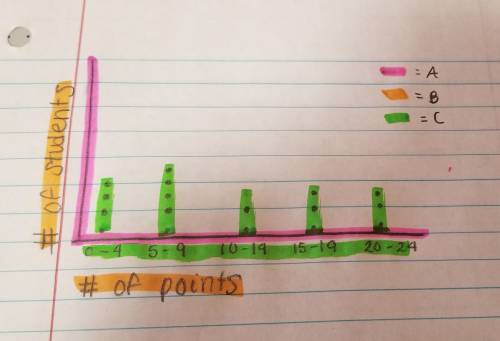
Agroup of 17 students participated in a quiz competition. their scores are shown below: score 0–4 5–9 10–14 15–19 20–24 number of students 4 5 2 3 3 part a: would a dot plot, a histogram, or a box plot best represent the data shown above. explain your answer. part b: provide a step-by-step description of how you would create the graph named in part a.

Answers: 2


Other questions on the subject: Mathematics
Mathematics, 20.06.2019 18:02, kayla114035
Can someone with this one pre-calc question? the finishing time for a runner completing the 200-meter dash is affected by the tail-wind speed, s. the change, t, in a runner's performance is modeled by the function shown below: t= 0.0119s^2 - 0.308s - 0.0003 predict the change in a runner's finishing time with a wind speed of 3 meters/second. note: a negative answer means the runner finishes with a lower time. round to the nearest hundredth.
Answers: 3
Mathematics, 21.06.2019 17:30, Serenitybella
Which are factor pairs of 350? choose all answers that are correct. a) 30 and 12 b) 35 and 10 c) 70 and 5 d) 2 and 125
Answers: 2
Do you know the correct answer?
Agroup of 17 students participated in a quiz competition. their scores are shown below: score 0–4 5...
Questions in other subjects:

English, 06.04.2020 18:04
Mathematics, 06.04.2020 18:04


History, 06.04.2020 18:04
Mathematics, 06.04.2020 18:04
Mathematics, 06.04.2020 18:04


