

Mathematics, 31.07.2019 05:30, jpwalker8535
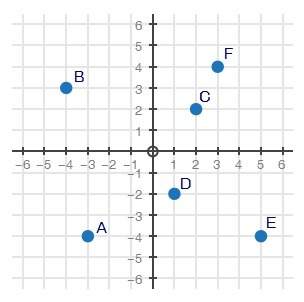
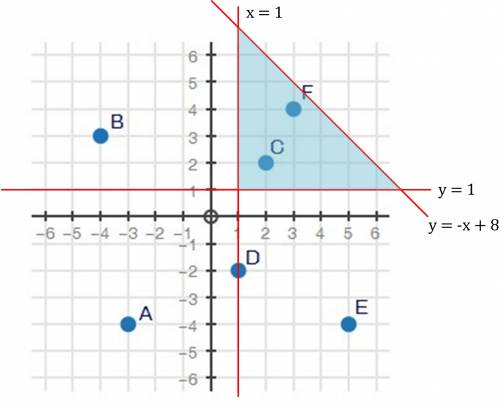
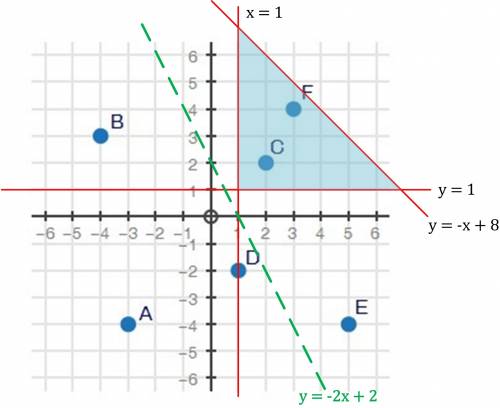
The coordinate plane below represents a city. points a through f are schools in the city. part a: using the graph above, create a system of inequalities that only contains points c and f in the overlapping shaded regions. explain how the lines will be graphed and shaded on the coordinate grid above. (5 points) part b: explain how to verify that the points c and f are solutions to the system of inequalities created in part a. (3 points) part c: natalie can only attend a school in her designated zone. natalie's zone is defined by y < −2x + 2. explain how you can identify the schools that natalie is allowed to attend. (2 points)

Answers: 1


Other questions on the subject: Mathematics
Mathematics, 21.06.2019 21:00, candicecorvette
Check all that apply. f is a function. f is a one-to-one function. c is a function. c is a one-to-one function.
Answers: 3
Mathematics, 22.06.2019 01:00, rrgg6234
(05.02) mr. morris is going to save money and replace his sailboat's mainsail himself. he must determine the area of the mainsail in order to buy the correct amount of material. calculate the area of the parallelogram to determine how much material should be purchased. be sure to explain how to decompose this shape into rectangles and triangles. describe their dimensions and show your work.
Answers: 1
Do you know the correct answer?
The coordinate plane below represents a city. points a through f are schools in the city. part a: u...
Questions in other subjects:


Geography, 14.02.2022 08:00
Mathematics, 14.02.2022 08:00

Mathematics, 14.02.2022 08:00

Medicine, 14.02.2022 08:00
Mathematics, 14.02.2022 08:00


