


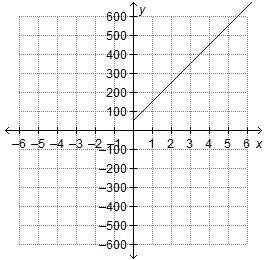
Which scenario is most likely the one shown on the graph?
-the total amount of money in...

Mathematics, 19.11.2019 22:31, leannhb3162
Which scenario is most likely the one shown on the graph?
-the total amount of money in the cash register, y, containing $50 in change and small bills and x $100 bills
-the total number of puzzle pieces, y, in a brand new 50-piece puzzle, and x brand-new 100-piece puzzles
-the total weight of the barbell, y, where the bar weighs 50 pounds and x 100-pound weights are added to it
-the total number of calories, y, in a salad with vegetables containing 50 calories topped with x ounces of salad dressing at 100 calories per ounce

Answers: 3
Other questions on the subject: Mathematics
Mathematics, 21.06.2019 14:10, jessicaflower277
Can't gugys answer the ratio question. this is urgent the plans of a building is drawn toward scale of 1: 1000. kfc the foyer on the plans measures 62mm by 54mm, how large is the foyer in real life?
Answers: 1
Mathematics, 21.06.2019 21:30, peytonamandac9114
Ahypothesis is: a the average squared deviations about the mean of a distribution of values b) an empirically testable statement that is an unproven supposition developed in order to explain phenomena a statement that asserts the status quo; that is, any change from what has been c) thought to be true is due to random sampling order da statement that is the opposite of the null hypothesis e) the error made by rejecting the null hypothesis when it is true
Answers: 2
Mathematics, 21.06.2019 22:30, foreignlove1039
If a flying disk is 139 meters in the air and travels at an average of 13 m/s how long is it in the air
Answers: 2
Mathematics, 22.06.2019 03:20, arangoaiden71
Aconcession manager at yankee stadium wants to know how temperature affects beer sales. she took a sample of 10 games and recorded the number of beers sold and the temperature in the middle of the game. temperature 80 68 78 79 87 74 86 92 77 84 number of beers 20533 1439 13829 21286 30985 17187 30240 87596 9610 28742 a. draw a scatter plot of the data. b. the manager estimates the regression equation to be: numberofbeers = −100, 678 + 1, 513 ∗ temperature draw this on your scatter plot. c. for one of the estimated points, indicate the residual with ei . d. for that same point, indicate what part of the variation is explained by the model with ˆyi − y¯.
Answers: 2
Do you know the correct answer?
Questions in other subjects:


Spanish, 10.11.2020 22:30

Arts, 10.11.2020 22:30

Physics, 10.11.2020 22:30
Spanish, 10.11.2020 22:30
Mathematics, 10.11.2020 22:30
Mathematics, 10.11.2020 22:30

SAT, 10.11.2020 22:30

Geography, 10.11.2020 22:30


