
![\bf \cfrac{d}{dx}[x^3]\implies \left. 3x^2\cfrac{}{}\right|_{x=1}\implies 3(1)^2\implies 3](/tpl/images/0390/3084/06ee8.png)


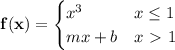
Iwant to make sure i got this right. pls asap i need it
calc 1 one question
...

Mathematics, 25.11.2019 21:31, presasjenifer1
Iwant to make sure i got this right. pls asap i need it
calc 1 one question

Answers: 2
Other questions on the subject: Mathematics
Mathematics, 21.06.2019 19:30, jasminetaylor4587
According to the data set, where should the upper quartile line of the box plot be placed?
Answers: 1
Do you know the correct answer?
Questions in other subjects:


History, 23.10.2019 23:00
Mathematics, 23.10.2019 23:00

Physics, 23.10.2019 23:00
Mathematics, 23.10.2019 23:00


