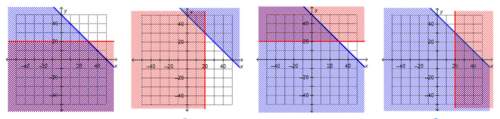
Fourth graph.
Step-by-step explanation:
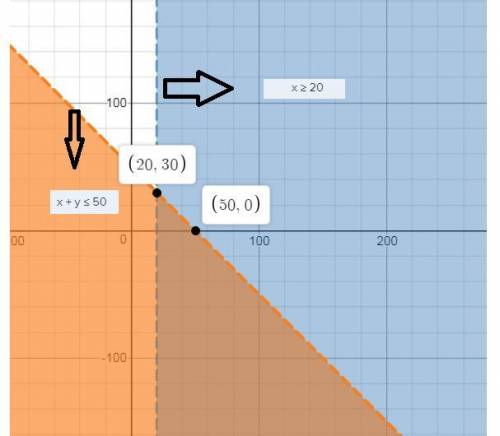
Using demos calculator we plot the graph.
Orange Shaded area shows the equation : 
Blue area shows the equation: 
Refer the attached image
The solution of the equations is (20,30) and (50,0)
The fourth graph shows the same solutions.
So, Graph 4 is correct.
Hence fourth graph represents the solution to the system of inequalities.