


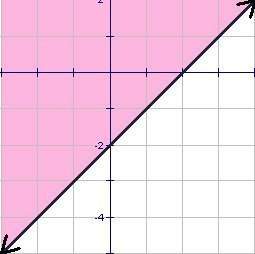
Which inequality represents the graph?
a) y < x - 2
b) y > x - 2
c) y ≤...

Mathematics, 21.12.2019 07:31, crom
Which inequality represents the graph?
a) y < x - 2
b) y > x - 2
c) y ≤ x - 2
d) y ≥ x - 2

Answers: 1
Other questions on the subject: Mathematics
Mathematics, 21.06.2019 19:30, jrassicworld4ever
Need now max recorded the heights of 500 male humans. he found that the heights were normally distributed around a mean of 177 centimeters. which statements about max’s data must be true? a) the median of max’s data is 250 b) more than half of the data points max recorded were 177 centimeters. c) a data point chosen at random is as likely to be above the mean as it is to be below the mean. d) every height within three standard deviations of the mean is equally likely to be chosen if a data point is selected at random.
Answers: 1
Mathematics, 21.06.2019 23:30, rainbowboi
What is the simplified form of square root of 400 to the 100th power ?
Answers: 1
Do you know the correct answer?
Questions in other subjects:

History, 09.11.2020 22:50
Mathematics, 09.11.2020 22:50

Mathematics, 09.11.2020 22:50
Mathematics, 09.11.2020 22:50


