

Mathematics, 26.07.2019 11:40, UndeadDelta
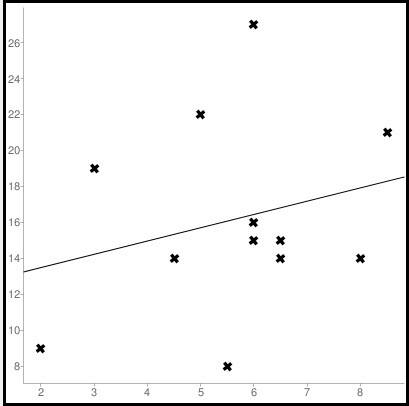
1. the table shows the distances, in meters, that each player in a game tossed a ball, and the total number of earned points each player made for those tosses. distance (m) 6.5 6 5 8.5 2 5.5 6.5 8 3 6 4.5 6 total earned points 15 15 22 21 9 8 14 14 19 27 14 16 (a) create a scatter plot of the data set. use the distance for the input variable and the total earned points for the output variable. (b) are there any clusters or outliers in the data set? if so, identify them.

Answers: 1


Similar questions
Mathematics, 17.07.2019 07:10, pcartei
Answers: 1
Mathematics, 20.07.2019 05:20, jacksonyodell8601
Answers: 3
Mathematics, 20.08.2019 22:00, gstevens
Answers: 2
Mathematics, 26.08.2019 10:30, liltrewill7008
Answers: 1
Do you know the correct answer?
1. the table shows the distances, in meters, that each player in a game tossed a ball, and the total...
Questions in other subjects:

Health, 09.03.2021 01:00
Mathematics, 09.03.2021 01:00

Mathematics, 09.03.2021 01:00


Biology, 09.03.2021 01:00

History, 09.03.2021 01:00

English, 09.03.2021 01:00


