

Mathematics, 26.07.2019 09:00, jgpjessi1854
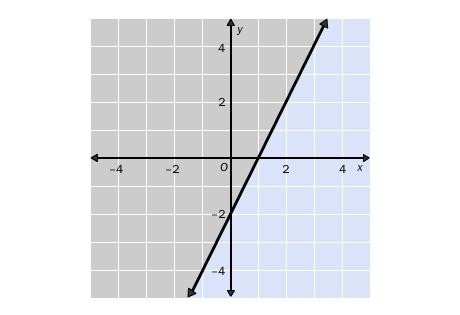
Choose the linear inequality that describes the graph. the gray area represents the shaded region. y ≤ 2x – 2 y ≥ 2x – 2 y ≥ 2x + 2 y ≥ –2x + 2

Answers: 2


Other questions on the subject: Mathematics
Mathematics, 21.06.2019 21:30, muncyemily
Which of the following shows the length of the third side, in inches, of the triangle below
Answers: 2
Mathematics, 22.06.2019 01:00, khloenm309
Which graph shows the solution to the system of linear inequalities? y-4t< 4 y
Answers: 1
Mathematics, 22.06.2019 03:00, samjohnson3637
What is the answer to question 11? richard simplified an expression in three steps, as shown taking 04.10 segment one exam part one (flvs)
Answers: 3
Do you know the correct answer?
Choose the linear inequality that describes the graph. the gray area represents the shaded region. y...
Questions in other subjects:

Mathematics, 06.09.2021 22:40


Business, 06.09.2021 22:40


Chemistry, 06.09.2021 22:40


