

Mathematics, 10.12.2019 08:31, talia43
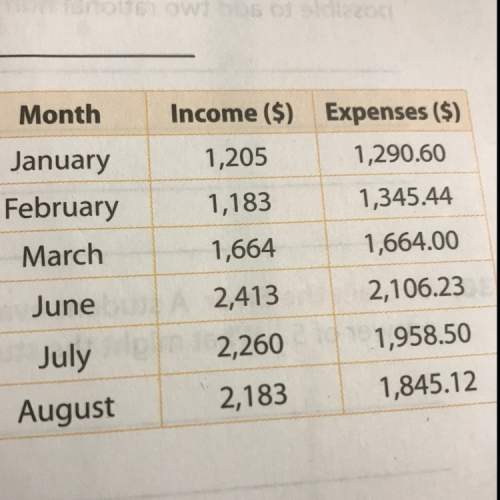
If the bakery started with an extra $250 from the profits in december describe how to use the information in the table to figure out the profit or loss of money at the bakery by the end of august. then calculate the profit or loss.

Answers: 1


Other questions on the subject: Mathematics
Mathematics, 22.06.2019 00:50, chinyere614
Identify the statement below as either descriptive or inferential statistics. upper a certain website sold an average of 117 books per day last week. is the statement an example of descriptive or inferential statistics? a. it is an example of descriptive statistics because it uses a sample to make a claim about a population. b. it is an example of inferential statistics because it uses a sample to make a claim about a population. c. it is an example of inferential statistics because it summarizes the information in a sample. d. it is an example of descriptive statistics because it summarizes the information in a sample.
Answers: 1
Mathematics, 22.06.2019 01:30, cindy9330
In the picture below, line pq is parallel to line rs, and the lines are cut by a transversal, line tu. the transversal is not perpendicular to the parallel lines. note: figure is not drawn to scale. which of the following are congruent angles?
Answers: 1
Mathematics, 22.06.2019 02:00, mathhelppls14
1. the manager of collins import autos believes the number of cars sold in a day (q) depends on two factors: (1) the number of hours the dealership is open (h) and (2) the number of salespersons working that day (s). after collecting data for two months (53 days), the manager estimates the following log-linear model: q 4 equation 1 a. explain, how to transform the log-linear model into linear form that can be estimated using multiple regression analysis. the computer output for the multiple regression analysis is shown below: q4 table b. how do you interpret coefficients b and c? if the dealership increases the number of salespersons by 20%, what will be the percentage increase in daily sales? c. test the overall model for statistical significance at the 5% significance level. d. what percent of the total variation in daily auto sales is explained by this equation? what could you suggest to increase this percentage? e. test the intercept for statistical significance at the 5% level of significance. if h and s both equal 0, are sales expected to be 0? explain why or why not? f. test the estimated coefficient b for statistical significance. if the dealership decreases its hours of operation by 10%, what is the expected impact on daily sales?
Answers: 2
Do you know the correct answer?
If the bakery started with an extra $250 from the profits in december describe how to use the inform...
Questions in other subjects:

Chemistry, 03.03.2021 06:50
Mathematics, 03.03.2021 06:50
Mathematics, 03.03.2021 06:50
Mathematics, 03.03.2021 06:50
Mathematics, 03.03.2021 06:50


Mathematics, 03.03.2021 06:50


