


Mpl
marc left his house to drive to work. he slowly pulls out of his driveway at a constant spe...

Mathematics, 18.10.2019 05:00, jagmeetcheema
Mpl
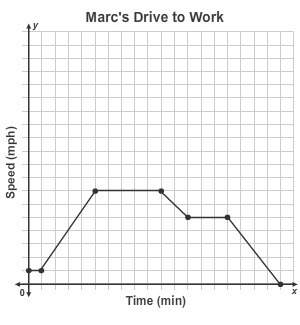
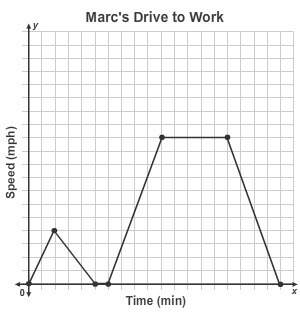
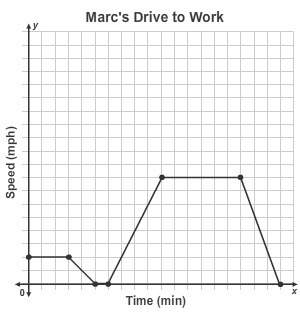
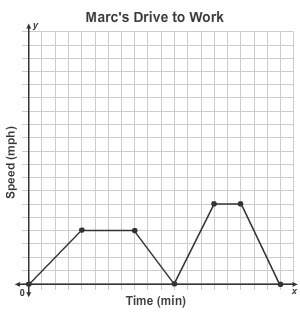
marc left his house to drive to work. he slowly pulls out of his driveway at a constant speed and continues at that speed until he slows and comes to a complete stop at the stop sign at the end of his street. he waits at the stop sign until it is his turn to go, and then his speed steadily increases until he reaches the speed limit. he drives at this constant speed until he approaches his office. he slows down steadily and comes to a complete stop in front of his office.
which graph represents marc’s drive to work?

Answers: 3
Other questions on the subject: Mathematics
Mathematics, 21.06.2019 16:30, IkweWolf4431
How to choose the sign of the radical in the denominator of the formula for the distance from a point to a line.
Answers: 2
Mathematics, 21.06.2019 18:30, leannhb3162
The bake stars picked 907 apples last weekend at a local orchard they made caramel apples and sold them in the bakery in trays of 6
Answers: 1
Mathematics, 21.06.2019 21:40, calebhoover03
Question 1 of 10 2 points different groups of 50 graduates of an engineering school were asked the starting annual salary for their first engineering job after graduation, and the sampling variability was low. if the average salary of one of the groups was $65,000, which of these is least likely to be the average salary of another of the groups? o a. $64,000 o b. $65,000 o c. $67,000 o d. $54,000
Answers: 2
Do you know the correct answer?
Questions in other subjects:
Mathematics, 29.06.2020 04:01
Mathematics, 29.06.2020 04:01


Chemistry, 29.06.2020 04:01
Biology, 29.06.2020 04:01
Mathematics, 29.06.2020 04:01


