

Mathematics, 01.07.2019 07:40, yoyo1542
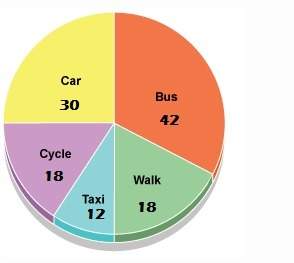
Asurvey was conducted in local town on modes of transportation to work. the following circle graph shows the number of people who utilize each mode of transportation. if 320 people were surveyed, about how many of them would be expected to take a bus to work? a. 42 b. 112 c. 130 d. 82

Answers: 1


Other questions on the subject: Mathematics
Mathematics, 21.06.2019 17:10, Andrewecolt1993
Which is a graph of a proportional relationship?
Answers: 1
Mathematics, 22.06.2019 00:10, jocelynfray16
Change negative exponents to positive. then solve. round to four decimal places
Answers: 3
Mathematics, 22.06.2019 04:00, pizzacrust1633
A. 120 degrees b. 90 degrees c. 30 degrees d. 60 degrees
Answers: 1
Do you know the correct answer?
Asurvey was conducted in local town on modes of transportation to work. the following circle graph s...
Questions in other subjects:
Mathematics, 18.07.2019 11:10

Business, 18.07.2019 11:10
Mathematics, 18.07.2019 11:10

Physics, 18.07.2019 11:10

Social Studies, 18.07.2019 11:10
Physics, 18.07.2019 11:10


