


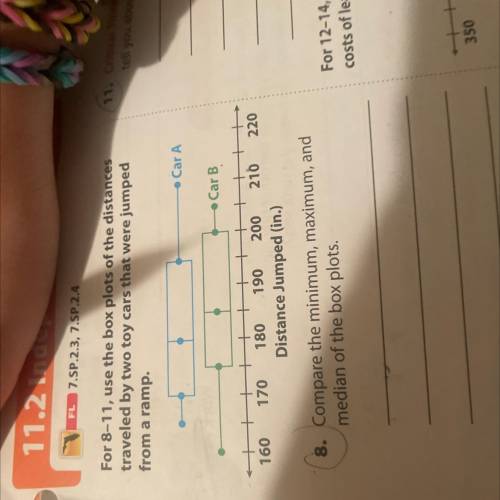
Compare the minimum, maximum, and
median of the box plots.
Compare the range and interquarti...

Mathematics, 20.04.2022 01:50, yoongnzl
Compare the minimum, maximum, and
median of the box plots.
Compare the range and interquartile range of the data in the box plots?
What do the box plots tell you about the distance of two cars?
What do you think whiskers tell you about the two data sets? HELP

Answers: 2
Other questions on the subject: Mathematics
Mathematics, 21.06.2019 16:00, juniorvaldez60
What are the related frequencies to the nearest hundredth of the columns of the two way table? group 1: a-102 b-34group 2: a-18 b-14edited: i don’t have all day to be waiting for an answer. i figured it out.
Answers: 2
Mathematics, 21.06.2019 18:10, normahernandez977
Find the solution set of this inequality. enter your answer in interval notation using grouping symbols. |8x-4| ≤ 12
Answers: 1
Do you know the correct answer?
Questions in other subjects:


Physics, 21.08.2019 04:20


