

Mathematics, 15.03.2022 06:00, lindasuebairdoyjpf7
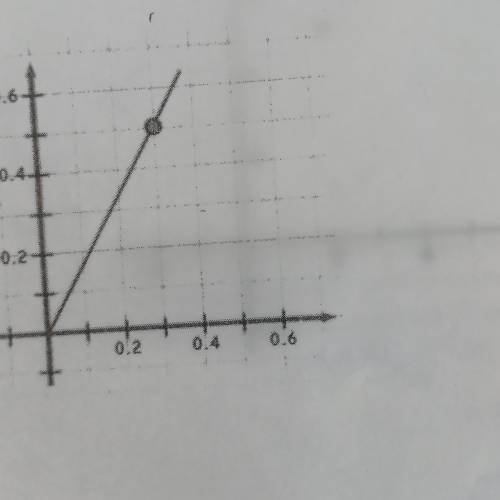
This graph shows a proportional relationship. What is the constant of proportionality for this relationship?
A) 5/3
B) 3/5
C) 1/2
D) 2

Answers: 2


Other questions on the subject: Mathematics
Mathematics, 21.06.2019 14:00, debordc17
You are assembling pieces of an iron gate to complete a fence. the finished gate will look like the one below. in order to assemble the gate it is important to under how the pieces are related. part 1: how are pies 1 and 2 in the archway related? part 2: how are the rectangular sections 5 and 6 in the center of the gate related to each other?
Answers: 1
Mathematics, 21.06.2019 15:20, ibidnnudny2584
The data in the table represent the height of an object over time. which model best represents the data? height of an object time (seconds) height (feet) 05 1 50 2 70 3 48 quadratic, because the height of the object increases or decreases with a multiplicative rate of change quadratic, because the height increases and then decreases exponential, because the height of the object increases or decreases with a multiplicative rate of change exponential, because the height increases and then decreases
Answers: 1
Mathematics, 21.06.2019 18:00, purplefish53
Jose predicted that he would sell 48 umbrellas. he actually sold 72 umbrellas. what are the values of a and b in the table below? round to the nearest tenth if necessary
Answers: 2
Mathematics, 21.06.2019 21:30, gonzalezashley152
In a test for esp (extrasensory perception), the experimenter looks at cards that are hidden from the subject. each card contains either a star, a circle, a wave, a cross or a square.(five shapes) as the experimenter looks at each of 20 cards in turn, the subject names the shape on the card. when the esp study described above discovers a subject whose performance appears to be better than guessing, the study continues at greater length. the experimenter looks at many cards bearing one of five shapes (star, square, circle, wave, and cross) in an order determined by random numbers. the subject cannot see the experimenter as he looks at each card in turn, in order to avoid any possible nonverbal clues. the answers of a subject who does not have esp should be independent observations, each with probability 1/5 of success. we record 1000 attempts. which of the following assumptions must be met in order to solve this problem? it's reasonable to assume normality 0.8(1000), 0.2(1000)%30 approximately normal 0.8(1000), 0.2(1000)% 10 approximately normal srs it is reasonable to assume the total number of cards is over 10,000 it is reasonable to assume the total number of cards is over 1000
Answers: 1
Do you know the correct answer?
This graph shows a proportional relationship. What is the constant of proportionality for this relat...
Questions in other subjects:


Biology, 18.11.2020 19:10
Mathematics, 18.11.2020 19:10
Mathematics, 18.11.2020 19:10
Mathematics, 18.11.2020 19:10
Mathematics, 18.11.2020 19:10

Chemistry, 18.11.2020 19:10


