

Mathematics, 14.03.2022 23:00, autumnkiewel200
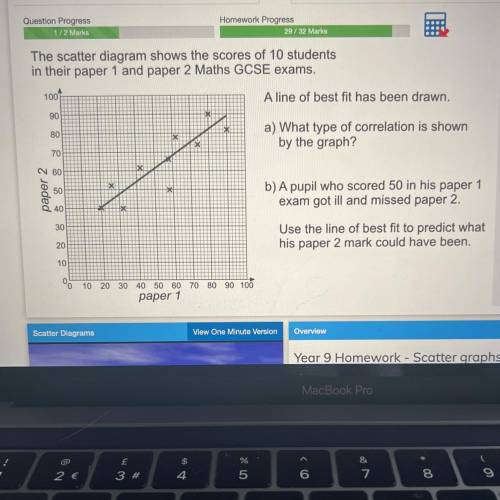
The scatter diagram shows the scores of 10 students in their paper 1 and paper 2 Maths GCSE exams.
A line of best fit has been drawn.
a) what type of correlation is shown by the graph
b) A pupil who scored 50 in his paper 1 exam got ill and missed paper2.
Use the line of best fit to predict what his paper 2 mark could have been.

Answers: 2


Other questions on the subject: Mathematics
Mathematics, 21.06.2019 20:00, bermudezs732
Graph the linear function using the slooe and y intercept
Answers: 2
Mathematics, 21.06.2019 22:00, angeline2004
Given the quadratic function f(x)=3x^2-24x+49 a. use “completing the squares” to convert the quadratic function into vertex form b. state the vertex c. find the x and y intercepts d. graph the function
Answers: 1
Mathematics, 22.06.2019 00:00, kimberly185
In a timed typing test lara typed 63 words per minute. estimate the number of words she should be able to type in half in hour show your work
Answers: 2
Do you know the correct answer?
The scatter diagram shows the scores of 10 students in their paper 1 and paper 2 Maths GCSE exams....
Questions in other subjects:

Chemistry, 06.05.2020 02:37


Biology, 06.05.2020 02:37

Mathematics, 06.05.2020 02:37

World Languages, 06.05.2020 02:37


