

Mathematics, 14.03.2022 09:40, rosie81
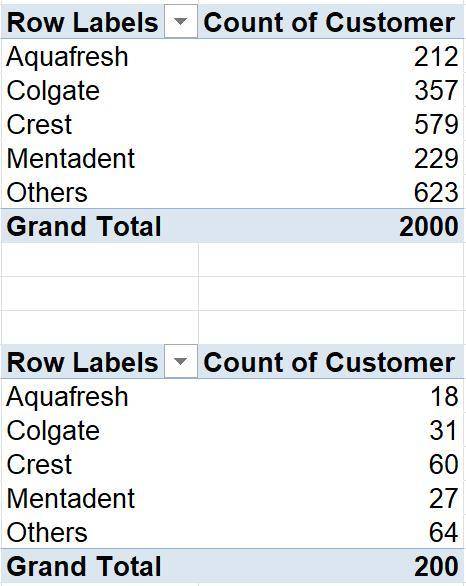
The pivot table below is a summary of data that contains market research information of 2000 customers who shop at a local drug store. The store is interested in the customers buying preferences of toothpaste. Assume that this data represents the population, calculate the below using the data set. A. What is the population mean and standard deviation for the proportion of customers who use Crest toothpaste? B. Using the data, select the first 200 customers as sampling data. Of these 200 samples, compute a point estimate and standard error of the portion of customers who prefer crest toothpaste C. Using the sample data in part b, of these 200 samples, what is the 95% confidence intervals for this sample proportion data?

Answers: 1


Other questions on the subject: Mathematics
Mathematics, 21.06.2019 16:00, dayanawhite64
Which term best describes the association between variables a and b? no association a negative linear association a positive linear association a nonlinear association a scatterplot with an x axis labeled, variable a from zero to ten in increments of two and the y axis labeled, variable b from zero to one hundred forty in increments of twenty with fifteen points in a positive trend.
Answers: 2
Mathematics, 21.06.2019 20:30, allimaycatp8qgaq
Secant ac and bd intersect at point e inside f what is the measure of aed if measurements cd equals 30 a b is 50 and cb is 170
Answers: 1
Do you know the correct answer?
The pivot table below is a summary of data that contains market research information of 2000 custome...
Questions in other subjects:

English, 13.04.2020 18:26
Mathematics, 13.04.2020 18:26
English, 13.04.2020 18:26
Mathematics, 13.04.2020 18:26

Social Studies, 13.04.2020 18:27

History, 13.04.2020 18:27
English, 13.04.2020 18:27


