

Mathematics, 16.02.2022 21:10, Masonb1849
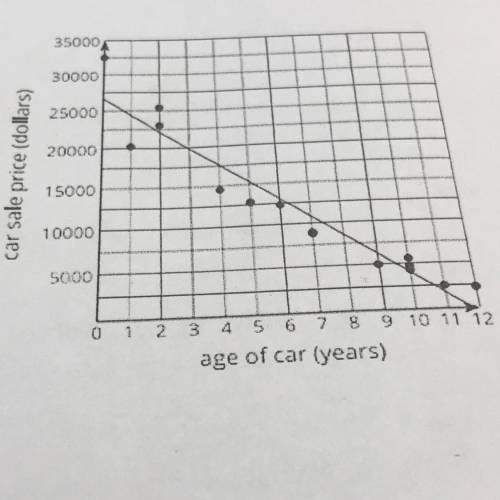
3. A local car salesperson created a scatter plot to display the
relationship between a car's sale price in dollars, y, and the age of
the carin years, x. The equation of the line that models the data in
the scatter plot is given by y = -2500x + 26000. This equation is
shown in the scatter plot.
a. where in the equation do you see the slope? what does it represent?
b. where in the graph do you see the y-intercept?what does it represent?
c. ava said the slope of the line -2500 and that it describes the rate at which the age of the car is decreasing. why is she inccorrect?
d. danielle explained that the older cars are more expensive? do you dissagree or agree?

Answers: 3


Other questions on the subject: Mathematics
Mathematics, 21.06.2019 22:00, stricklandashley43
1. how do you convert the repeating, nonterminating decimal 0. to a fraction? explain the process as you solve the problem.
Answers: 2
Mathematics, 22.06.2019 00:30, tdyson3p6xvtu
Select the correct answer from each drop-down menu. let c(g) be the total cost, including shoe rental, for bowling g games at pin town lanes. c(g) = 5g+3 so, c(6) = 8? 33? 30? or 14? this means that for a $6 shoe rental? for $6 per game? for 6 games? for a total cost of $6? , the games are $8 each? total cost is $33? number of games is 14? or total cost is $30? reset next
Answers: 1
Do you know the correct answer?
3. A local car salesperson created a scatter plot to display the
relationship between a car's sale...
Questions in other subjects:

Mathematics, 02.10.2020 20:01

Law, 02.10.2020 20:01

Mathematics, 02.10.2020 20:01
Mathematics, 02.10.2020 20:01


