

Mathematics, 16.02.2022 05:40, kaitlngley2367
PLS HELP ME PLEASE
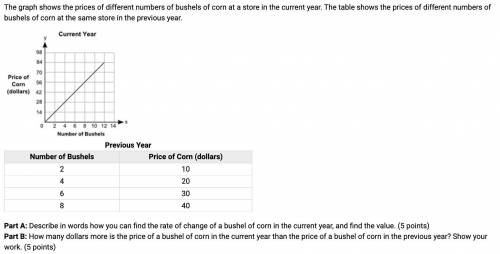
The graph shows the prices of different numbers of bushels of corn at a store in the current year. The table shows the prices of different numbers of bushels of corn at the same store in the previous year. A graph shows Number of Bushels on x-axis and Price of Corn in dollars on y-axis. The x-axis scale is shown from 0 to 14 at increments of 2, and the y-axis scale is shown from 0 to 98 at increments of 14. A straight line joins the ordered pairs 2, 14 and 4, 28 and 6, 42 and 8, 56 and 10, 70 and 12, 84.
Previous Year Number of Bushels Price of Corn (dollars) 2 10 4 20 6 30 8 40
Part A: Describe in words how you can find the rate of change of a bushel of corn in the current year, and find the value. (5 points)
Part B: How many dollars more is the price of a bushel of corn in the current year than the price of a bushel of corn in the previous year? Show your work.

Answers: 3


Other questions on the subject: Mathematics
Mathematics, 21.06.2019 17:30, beevus2666
Hiroaki wants to find 3 3/4 - 7/8 explain why he must rename 3 3/4 to do the subtraction.
Answers: 3
Do you know the correct answer?
PLS HELP ME PLEASE
The graph shows the prices of different numbers of bushels of corn at a store i...
Questions in other subjects:

Biology, 29.07.2019 23:00

Biology, 29.07.2019 23:00
Mathematics, 29.07.2019 23:00


