

Mathematics, 12.02.2022 04:30, JUSTDAN6929
The table below shows the year and the number of households in a building that had high-
speed broadband internet access.
11
16
23
33
42
47
Number of
Households
Year
2002 2003 2004 2005 2006 2007
For which interval of time was the average rate of change the smallest?
1 2002 - 2004
3) 2004 - 2006
2) 2003 - 2005
4) 2005 - 2007
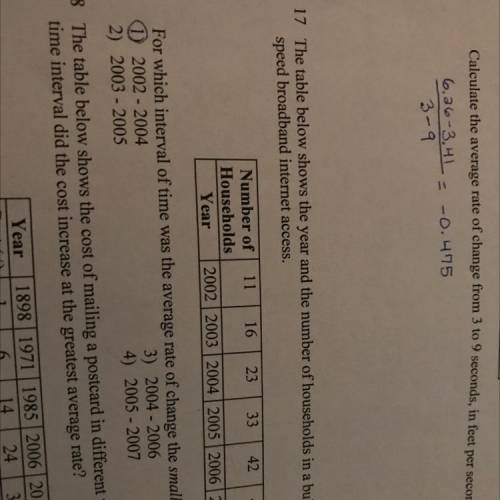

Answers: 3


Other questions on the subject: Mathematics
Mathematics, 20.06.2019 18:04, umezinwachukwuebuka1
Two number cubes are rolled- one blue and one yellow. part a) find the probability that the blue cube is less than 3 and the product is 8. part b) is this event independent or dependent? explain why. your
Answers: 3
Mathematics, 21.06.2019 22:30, jakails359
Atotal of 766 tickets were sold for the school play. they were either adult tickets or student tickets. there were 66 more student tickets sold than adult tickets. how many adult tickets were sold?
Answers: 1
Mathematics, 21.06.2019 22:30, 20alondra04
Explain how you could use the interactive table to tell if sets of points are on the same line. math 8
Answers: 2
Do you know the correct answer?
The table below shows the year and the number of households in a building that had high-
speed br...
Questions in other subjects:
Mathematics, 25.05.2021 18:00
Mathematics, 25.05.2021 18:00
Mathematics, 25.05.2021 18:00
Mathematics, 25.05.2021 18:00


