


Hours of Homework

Mathematics, 08.02.2022 01:00, annie8348
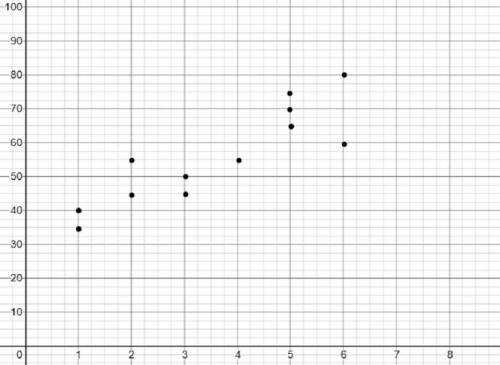
Consider this scatter plot.
Test Scores in Relation to Homework
Hours of Homework
(a) Is the relationship linear or not linear? Justify your response.
(b) Is the relationship increasing or decreasing? Find the slope and use it to help justify your answer.
(c) Paul uses the function y = 7x + 30 to model the situation. What score does Paul’s model predict for 3
hours of homework? Hint: It’s _not_ asking you to use the graph.
(d) Describe what the number 30 in Part (c) mean in the context of the situation? Hint: Think about what
kind of function equation you have in Part B.

Answers: 2
Other questions on the subject: Mathematics
Mathematics, 21.06.2019 16:00, alannismichelle9
In the diagram, the ratio of ab to ae is (1/2) . what is the ratio of the length of to the length of ?
Answers: 3
Mathematics, 21.06.2019 17:00, ninjapig647
Write numerical coefficient of y² in the expression 2x² - 15xy – 7y²
Answers: 1
Mathematics, 21.06.2019 19:00, jthollis1348
Find the y-intercept and x-intercept for the equation 5x-3y=60 what is the y-intercept
Answers: 1
Do you know the correct answer?
Consider this scatter plot.
Test Scores in Relation to Homework
Hours of Homework
Hours of Homework
Questions in other subjects:


History, 22.09.2019 05:30


Social Studies, 22.09.2019 05:30


