

Mathematics, 07.02.2022 19:50, a6igai1
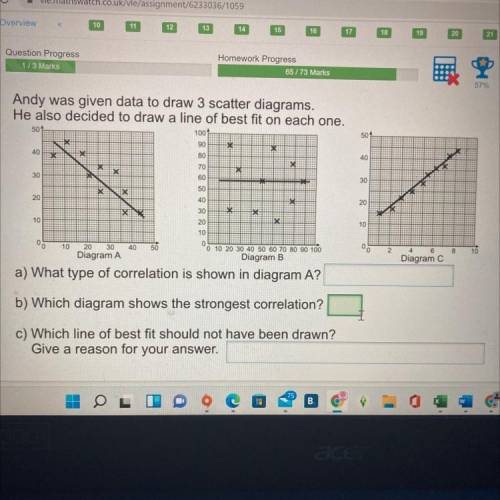
Andy was given data to draw 3 scatter diagrams.
He also decided to draw a line of best fit on each one.
501
1001
50
X
90
80
IX
40
X
40
X
70
EX
X
EX
30
60
30
क
50
X
X
20
x
20
40
30
20
INS
19
X
10
10
0
10
40
50
10
0
0 10 20 30 40 50 60 70 80 90 100
Diagram B
0
2
4
6
8
10
Diagram
20 30
Diagram A
a) What type of correlation is shown in diagram A?
b) Which diagram shows the strongest correlation?
c) Which line of best fit should not have been drawn?
Give a reason for your answer.

Answers: 1


Other questions on the subject: Mathematics
Mathematics, 21.06.2019 17:30, andrewjschoon2876
Which equation represents a line that is parallel to the line whose equation is 3x-2y=7( show all work)
Answers: 3
Do you know the correct answer?
Andy was given data to draw 3 scatter diagrams.
He also decided to draw a line of best fit on each...
Questions in other subjects:

Social Studies, 16.10.2019 06:50

History, 16.10.2019 06:50

Business, 16.10.2019 06:50
Mathematics, 16.10.2019 06:50

Geography, 16.10.2019 06:50
Mathematics, 16.10.2019 06:50
Mathematics, 16.10.2019 06:50


