

Mathematics, 24.01.2022 23:40, amy290
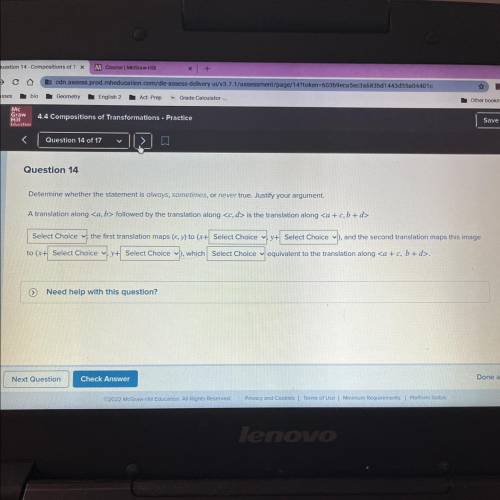
Determine whether the statement is always, sometimes, or never true. Justify your argument.
A translation along followed by the translation along is the translation along
Select Choice the first translation maps (x, y) to (x+ Select Choice 7+ Select Choice and the second translation maps this image
to (x+ Select Choice y+ Select Choice . ), which Select Choice equivalent to the translation along

Answers: 1


Other questions on the subject: Mathematics
Mathematics, 21.06.2019 16:00, kell22wolf
Part one: measurements 1. measure your own height and arm span (from finger-tip to finger-tip) in inches. you will likely need some from a parent, guardian, or sibling to get accurate measurements. record your measurements on the "data record" document. use the "data record" to you complete part two of this project. name relationship to student x height in inches y arm span in inches archie dad 72 72 ginelle mom 65 66 sarah sister 64 65 meleah sister 66 3/4 67 rachel sister 53 1/2 53 emily auntie 66 1/2 66 hannah myself 66 1/2 69 part two: representation of data with plots 1. using graphing software of your choice, create a scatter plot of your data. predict the line of best fit, and sketch it on your graph. part three: the line of best fit include your scatter plot and the answers to the following questions in your word processing document 1. 1. which variable did you plot on the x-axis, and which variable did you plot on the y-axis? explain why you assigned the variables in that way. 2. write the equation of the line of best fit using the slope-intercept formula $y = mx + b$. show all your work, including the points used to determine the slope and how the equation was determined. 3. what does the slope of the line represent within the context of your graph? what does the y-intercept represent? 5. use the line of best fit to you to describe the data correlation.
Answers: 2
Mathematics, 21.06.2019 17:30, AzuraSchaufler
The graph below represents the number of dolphins in a dolphin sanctuary. select all the key features of this function.
Answers: 2
Mathematics, 21.06.2019 18:30, Raewolf25
Need an artist designed a badge for a school club. figure abcd on the coordinate grid below shows the shape of the badge: the badge is enlarged and plotted on the coordinate grid as figure jklm with point j located at (2, -2) and point m is located at (5, 4). which of these could be the coordinates for point l? a. (2, 4) b. (8, 4) c. (5, 1) d. (5, 7)
Answers: 2
Do you know the correct answer?
Determine whether the statement is always, sometimes, or never true. Justify your argument.
A tran...
Questions in other subjects:

English, 05.10.2019 23:30


Social Studies, 05.10.2019 23:30
Mathematics, 05.10.2019 23:30


History, 05.10.2019 23:30
Social Studies, 05.10.2019 23:30


