

Mathematics, 24.01.2022 09:30, nicollexo21
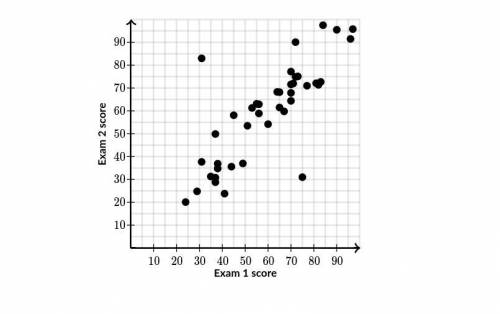
The plot shown below describes the relationship between students' scores on the first exam in a class and their corresponding scores on the second exam in the class.
Which of the following is the best estimate of the average change in the score on Exam 2 associated with a 1 point increase in the score on Exam 1?
Choose 1
(Choice A)
1/4 point
(Choice B)
1/2 point
(Choice C)
1 point
(Choice D)
2 points

Answers: 2


Other questions on the subject: Mathematics
Mathematics, 21.06.2019 13:30, aliami0306oyaj0n
Suppose a triangle has two sides of length 32 and 35, and that the angle between these two sides is 120°. which equation should you solve to find the length of the third side of the triangle?
Answers: 1
Mathematics, 21.06.2019 19:40, evarod
Afactory makes propeller drive shafts for ships. a quality assurance engineer at the factory needs to estimate the true mean length of the shafts. she randomly selects four drive shafts made at the factory, measures their lengths, and finds their sample mean to be 1000 mm. the lengths are known to follow a normal distribution whose standard deviation is 2 mm. calculate a 95% confidence interval for the true mean length of the shafts. input your answers for the margin of error, lower bound, and upper bound.
Answers: 3
Mathematics, 22.06.2019 00:00, brandon1748
Ascientist studied a population of workers to determine whether verbal praise and/or tangible rewards affect employee productivity. in the study, some workers were offered verbal praise, some were offered tangible rewards (gift cards, presents, and some were offered neither. the productivity of each participant was measured throughout the study by recording the number of daily tasks completed by each employee. which inference might the scientists make based on the given information? a.) the number of daily tasks completed by each employee may influence the dependent variable, which is whether the employee receives verbal praise, tangible rewards, or neither. b.) verbal praise and/or tangible rewards may influence the independent variable, which is the number of daily tasks completed by each employee. c.) verbal praise and/or tangible rewards may influence the dependent variable, which is the number of daily tasks completed by each employee. d.) the dependent variables, which are verbal praise and tangible rewards, may influence the number of daily tasks completed by each employee.
Answers: 1
Do you know the correct answer?
The plot shown below describes the relationship between students' scores on the first exam in a clas...
Questions in other subjects:
Mathematics, 03.08.2019 23:00

Health, 03.08.2019 23:00

Biology, 03.08.2019 23:00

History, 03.08.2019 23:00

Biology, 03.08.2019 23:00
Mathematics, 03.08.2019 23:00

Chemistry, 03.08.2019 23:00


