


The table shows some values of g(x). The
average rate of change of g(x) over the interval
1s...

Mathematics, 16.01.2022 04:40, xodees
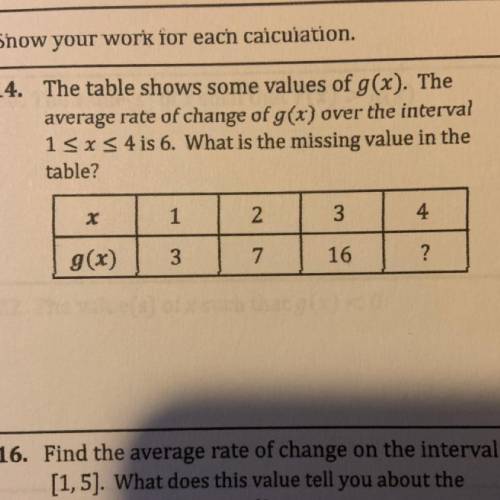
The table shows some values of g(x). The
average rate of change of g(x) over the interval
1sxs 4 is 6. What is the missing value in the
table?

Answers: 1
Other questions on the subject: Mathematics
Mathematics, 22.06.2019 00:20, arianasg06
When steve woke up. his temperature was 102 degrees f. two hours later it was 3 degrees lower. what was his temperature then?
Answers: 3
Mathematics, 22.06.2019 01:30, kadinmorgan
Acell phone company offers two plans to its subscribers. at the time new subscribers sign up, they are asked to provide some demographic information. the mean yearly income for a sample of 40 subscribers to plan a is $45,000 with a standard deviation of $9,200. for a sample of 25 subscribers to plan b, the mean income is $64,300 with a standard deviation of $7,100. at the 0.025 significance level, is it reasonable to conclude the mean income of those selecting plan b is larger? assume unequal population standard deviations. hint: for the calculations, assume the plan a as the first sample. what is the decision rule? (negative amount should be indicated by a minus sign. round your answer to 3 decimal places.) compute the value of the test statistic. (negative amount should be indicated by a minus sign. round your answer to 2 decimal places.) what is your decision regarding h0 ? reject h0 fail to reject h0 compute the p-value. less than 0.01 between 0.01 and 0.025 between 0.025 and 0.05 between 0.05 and 0.10 greater than 0.10
Answers: 3
Mathematics, 22.06.2019 01:30, SGARCIA25
Have you ever been in the middle of telling a story and had to use hand gestures or even a drawing to make your point? in algebra, if we want to illustrate or visualize a key feature of a function, sometimes we have to write the function in a different form—such as a table, graph, or equation—to determine the specific key feature we’re looking for. think about interactions with others and situations you’ve come across in your own life. how have you had to adjust or change the way you represented something based on either the concept you were trying to describe or the person you were interacting with? explain how the complexity or layout of the concept required you to change your style or presentation, or how the person’s unique learning style affected the way you presented the information.
Answers: 1
Mathematics, 22.06.2019 03:00, Suhayb981
Plzz ! if you were constructing a triangular frame, and you had wood in the length of 4 inches, 4 inches, and 7 inches, would it make a triangle? would you be able to create a frame from these pieces of wood? yes or no? = explain your mathematical thinking/show your work:
Answers: 1
Do you know the correct answer?
Questions in other subjects:


English, 06.11.2019 03:31


