


NEED HELP
8. the table shows solutions for the inequality y<-x-1?
9. Which graph is...

Mathematics, 09.01.2022 07:50, B1GPAP1
NEED HELP
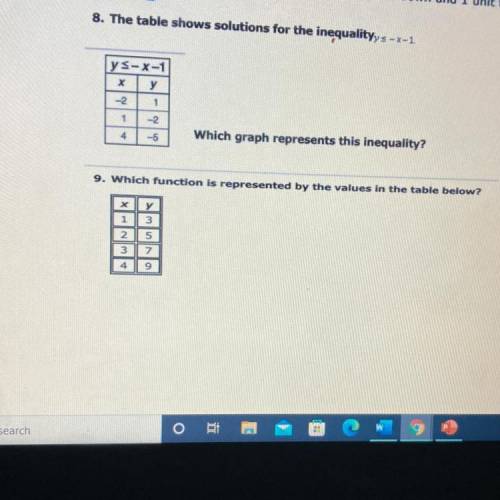
8. the table shows solutions for the inequality y<-x-1?
9. Which graph is represented by the values in the tables below?

Answers: 1
Other questions on the subject: Mathematics
Mathematics, 22.06.2019 01:30, marianasanin2007
Two numbers have a sum of 93. if one number is p, express the other number in terms of p.
Answers: 1
Do you know the correct answer?
Questions in other subjects:
Mathematics, 09.09.2019 00:10
Mathematics, 09.09.2019 00:10


Mathematics, 09.09.2019 00:10
Mathematics, 09.09.2019 00:10


