

Mathematics, 03.01.2022 01:30, nae9587
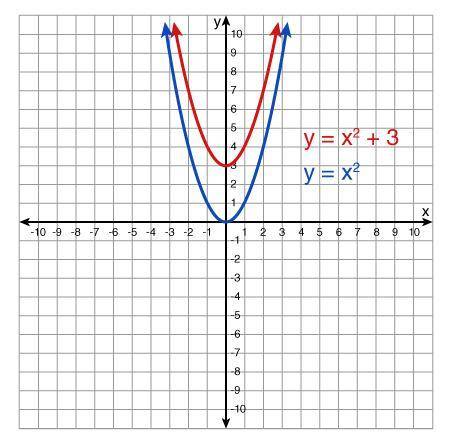
A quadratic function models the graph of a parabola. The quadratic functions, y = x2 and y = x2 + 3, are modeled in the graphs of the parabolas shown below.
Determine which situations best represent the scenario shown in the graph of the quadratic functions, y = x2 and y = x2 + 3. Select all that apply ( MULTIPLE CHOICE!! )
A) From x = -2 to x = 0, the average rate of change for both functions is negative.
B) For the quadratic function, y = x2, the coordinate (2, 3) is a solution to the equation of the function.
C) The quadratic function, y = x2 + 3, has an x-intercept at the origin.
D) The quadratic function, y = x2, has an x-intercept at the origin.
E) From x = -2 to x = 0, the average rate of change for both functions is positive.
D) For the quadratic function, y = x2 + 3, the coordinate (2, 7) is a solution to the equation of the function.

Answers: 1


Other questions on the subject: Mathematics
Mathematics, 21.06.2019 17:00, liddopiink1
Find the area of a parallelogram with the given vertices. p(-2, -5), q(9, -5), r(1, 5), s(12, 5)
Answers: 1
Mathematics, 21.06.2019 19:10, Lewis5442
Do more republicans (group a) than democrats (group b) favor a bill to make it easier for someone to own a firearm? two hundred republicans and two hundred democrats were asked if they favored a bill that made it easier for someone to own a firearm. how would we write the alternative hypothesis?
Answers: 1
Do you know the correct answer?
A quadratic function models the graph of a parabola. The quadratic functions, y = x2 and y = x2 + 3,...
Questions in other subjects:


Computers and Technology, 05.12.2019 00:31

Physics, 05.12.2019 00:31


History, 05.12.2019 00:31
Mathematics, 05.12.2019 00:31
Mathematics, 05.12.2019 00:31


