

Mathematics, 02.01.2022 14:00, Hannahrose911
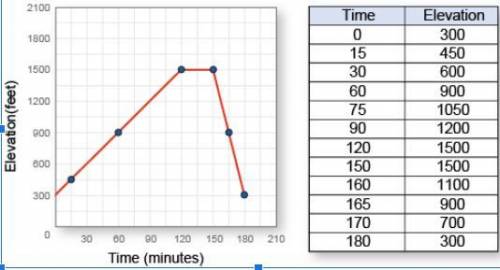
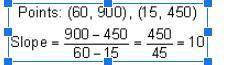
1. Confirm or disprove Ernest's work by selecting two different points and applying the slope formula. Be sure to identify the points you chose. (2 points)
2. What does the slope tell you about the rate of change in elevation during Ryan's uphill climb? What was the total elevation change? (2 points: 1 for identifying the rate of change, 1 for the total elevation change)
3. What is the slope of the graph between 120 and 150 minutes? What does this mean in terms of change in elevation? (2 points: 1 for the slope, 1 for the explanation)

Answers: 3


Other questions on the subject: Mathematics
Mathematics, 21.06.2019 14:10, jessicaflower277
Can't gugys answer the ratio question. this is urgent the plans of a building is drawn toward scale of 1: 1000. kfc the foyer on the plans measures 62mm by 54mm, how large is the foyer in real life?
Answers: 1
Mathematics, 21.06.2019 15:00, Shavaila18
The data shown in the table below represents the weight, in pounds, of a little girl, recorded each year on her birthday. age (in years) weight (in pounds) 2 32 6 47 7 51 4 40 5 43 3 38 8 60 1 23 part a: create a scatter plot to represent the data shown above. sketch the line of best fit. label at least three specific points on the graph that the line passes through. also include the correct labels on the x-axis and y-axis. part b: algebraically write the equation of the best fit line in slope-intercept form. include all of your calculations in your final answer. part c: use the equation for the line of best fit to approximate the weight of the little girl at an age of 14 years old.
Answers: 3
Mathematics, 21.06.2019 15:40, helper4282
The number of lattes sold daily for two coffee shops is shown in the table: lattes 12 52 57 33 51 15 46 45 based on the data, what is the difference between the median of the data, including the possible outlier(s) and excluding the possible outlier(s)? 48.5 23 8.4 3
Answers: 3
Mathematics, 21.06.2019 16:50, lunamoon1
The rate of decay of a radioactive substance depends upon the amount present initially. the mass y (mg) of the radioactive substance cobalt-60 present in a sample at time t (years) is represented by the exponential equation y=50e −0.1315 t . answer the following questions in complete sentences. 1. how does the exponential equation above compare to the equation for simple interest that is compounded continuously? explain the similarities. 2. what is the initial amount of cobalt-60 in the sample? 2. how much cobalt-60 is left after 8.4 years? show your work. 3. what would be the y-intercept of the graph? what does it represent? 4. after how many years will the amount of cobalt-60 left be 6.25 mg? explain what happens to the cobalt-60 after 50 years? 5. discuss some “real-world” examples and uses of cobalt-60
Answers: 1
Do you know the correct answer?
1. Confirm or disprove Ernest's work by selecting two different points and applying the slope formul...
Questions in other subjects:
Mathematics, 22.05.2021 01:30

Mathematics, 22.05.2021 01:30

History, 22.05.2021 01:30
Mathematics, 22.05.2021 01:30
Mathematics, 22.05.2021 01:30
Mathematics, 22.05.2021 01:30
Mathematics, 22.05.2021 01:30
Mathematics, 22.05.2021 01:30


