


Graph f(x)=−|x+4|−3.
Use the ray tool to graph the function.
...

Mathematics, 02.01.2022 08:10, Joseph17Peralta
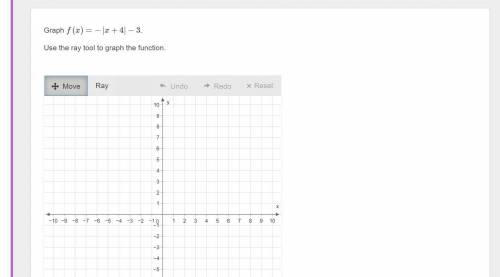
Graph f(x)=−|x+4|−3.
Use the ray tool to graph the function.

Answers: 3
Other questions on the subject: Mathematics
Mathematics, 21.06.2019 19:30, tiwaribianca475
Cor d? ? me ? max recorded the heights of 500 male humans. he found that the heights were normally distributed around a mean of 177 centimeters. which statements about max’s data must be true? a) the median of max’s data is 250 b) more than half of the data points max recorded were 177 centimeters. c) a data point chosen at random is as likely to be above the mean as it is to be below the mean. d) every height within three standard deviations of the mean is equally likely to be chosen if a data point is selected at random.
Answers: 1
Mathematics, 22.06.2019 03:00, logsdonella
If bill bought a home for $210,000 and he sold it a year later for $120,000 his percentage of loss is
Answers: 2
Mathematics, 22.06.2019 03:30, bar23cardenine01
How much money does ron have left each month after his fixed expenses? ron graduated from college five years ago. he recently bought a house, but shares it with a housemate who pays him $800 a month for rent and utilities. ron is putting a budget worksheet together so he will have a better idea of where his money is going and where he can save. enlarge
Answers: 3
Mathematics, 22.06.2019 03:30, diametriagay
Graph the linear equation find three points on the graph -x+2y=11
Answers: 2
Do you know the correct answer?
Questions in other subjects:
Mathematics, 04.12.2020 17:40


Chemistry, 04.12.2020 17:40
Mathematics, 04.12.2020 17:40

English, 04.12.2020 17:40


