

Mathematics, 20.12.2021 14:00, Isabelcastillox1085
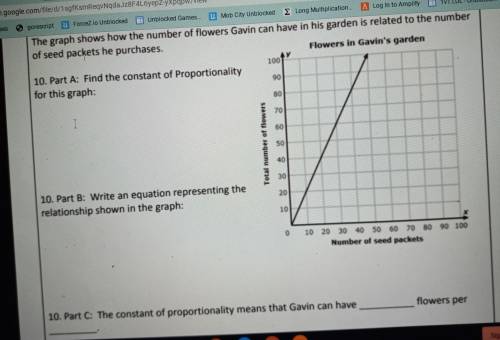
The graph shows how the number of flowers Gavin can have in his garden is related to the number of seed packets he purchases.
Part A: Find the constant of Proportionality for this graph:
Part B: Write an equation representing the relationship shown in the graph:
Part C: The constant of proportionality means that Gavin can have_ flowers per_.

Answers: 1


Other questions on the subject: Mathematics
Mathematics, 21.06.2019 23:00, britann4256
Calculate the average rate of change over the interval [1, 3] for the following function. f(x)=4(5)^x a. -260 b. 260 c. 240 d. -240
Answers: 1
Do you know the correct answer?
The graph shows how the number of flowers Gavin can have in his garden is related to the number of s...
Questions in other subjects:
Mathematics, 12.02.2020 04:19
Mathematics, 12.02.2020 04:19


Geography, 12.02.2020 04:19


