

Mathematics, 17.12.2021 17:10, mickellife4659
Sir Francis Galton, in the late 1800s, was the first to introduce the statistical concepts of regression and correlation. He studied the relationships between pairs of variables such as the size of parents and the size of their offspring.
Data similar to that which he studied are given below, with the variable x denoting the height (in centimeters) of a human father and the variable y denoting the height at maturity (in centimeters) of the father's oldest (adult) son. The data are given in tabular form and also displayed in the Figure 1 scatter plot, which gives the least-squares regression line as well. The equation for this line is =y+88.570.52x
.
Height of father, x
(in centimeters)Height of son, y
(in centimeters)
160.6170.6
181.9179.2
190.0195.4
175.1179.5
162.4167.9
201.7190.5
184.5189.0
157.2174.9
173.8170.7
182.0188.3
172.4182.3
200.4190.7
193.6188.9
176.7174.5
190.1188.7
187.9176.2
x
150
160
170
180
190
200
210
y
150
160
170
180
190
200
210
0
Figure 1
Answer the following:
1. Fill in the blank: For these data, heights of sons that are greater than the mean of the heights of sons tend to be paired with heights of fathers that are the mean of the heights of fathers. Choose onegreater thanless than
2. According to the regression equation, for an increase of one centimeter in father's height, there is a corresponding increase of how many centimeters in son's height?
3. From the regression equation, what is the predicted son's height (in centimeters) when the height of the father is 187.9 centimeters? (Round your answer to at least one decimal place.)
4. What was the observed son's height (in centimeters) when the height of the father was 187.9 centimeters?

Answers: 1
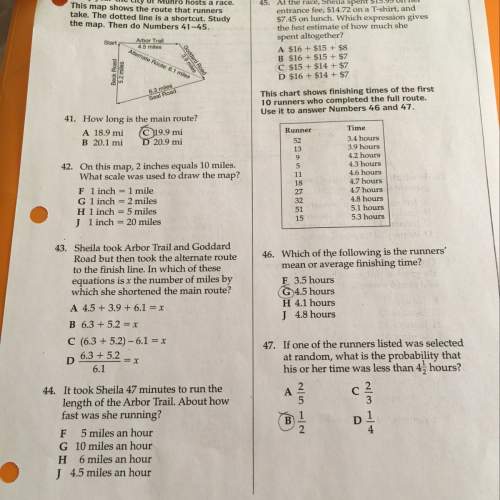


Other questions on the subject: Mathematics
Mathematics, 21.06.2019 18:00, ReeseMoffitt8032
In a graph with several intervals o data how does a constant interval appear? what type of scenario produces a constant interval?
Answers: 1
Mathematics, 21.06.2019 19:30, mary9590
Cone w has a radius of 8 cm and a height of 5 cm. square pyramid x has the same base area and height as cone w. paul and manuel disagree on how the volumes of cone w and square pyramid x are related. examine their arguments. which statement explains whose argument is correct and why? paul manuel the volume of square pyramid x is equal to the volume of cone w. this can be proven by finding the base area and volume of cone w, along with the volume of square pyramid x. the base area of cone w is π(r2) = π(82) = 200.96 cm2. the volume of cone w is one third(area of base)(h) = one third third(200.96)(5) = 334.93 cm3. the volume of square pyramid x is one third(area of base)(h) = one third(200.96)(5) = 334.93 cm3. the volume of square pyramid x is three times the volume of cone w. this can be proven by finding the base area and volume of cone w, along with the volume of square pyramid x. the base area of cone w is π(r2) = π(82) = 200.96 cm2. the volume of cone w is one third(area of base)(h) = one third(200.96)(5) = 334.93 cm3. the volume of square pyramid x is (area of base)(h) = (200.96)(5) = 1,004.8 cm3. paul's argument is correct; manuel used the incorrect formula to find the volume of square pyramid x. paul's argument is correct; manuel used the incorrect base area to find the volume of square pyramid x. manuel's argument is correct; paul used the incorrect formula to find the volume of square pyramid x. manuel's argument is correct; paul used the incorrect base area to find the volume of square pyramid x.
Answers: 3
Do you know the correct answer?
Sir Francis Galton, in the late 1800s, was the first to introduce the statistical concepts of regres...
Questions in other subjects:

History, 05.05.2020 07:05

English, 05.05.2020 07:05


Computers and Technology, 05.05.2020 07:05
Mathematics, 05.05.2020 07:05
Physics, 05.05.2020 07:05


