


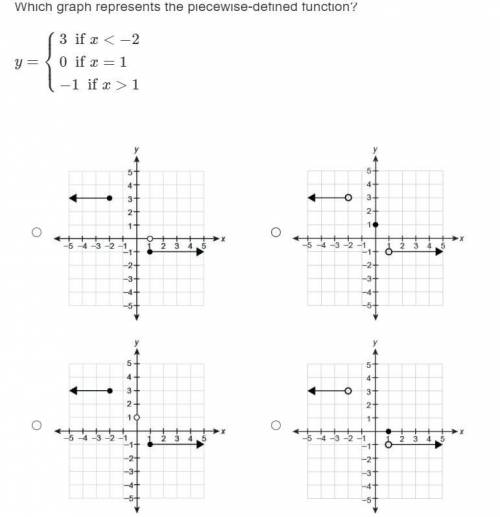
Which graph represents the piecewise-defined function?
3 if x < -2
y= 0 if x = 1
-...

Mathematics, 17.12.2021 02:10, chaparro0512
Which graph represents the piecewise-defined function?
3 if x < -2
y= 0 if x = 1
-1 if x < 1

Answers: 3
Other questions on the subject: Mathematics
Mathematics, 21.06.2019 17:00, alannismichelle9
The following graph shows the consumer price index (cpi) for a fictional country from 1970 to 1980? a.) 1976 - 1978b.) 1972 - 1974c.) 1974 - 1976d.) 1978 - 1980
Answers: 1
Mathematics, 21.06.2019 20:20, maxi12312345
Aline passes through (1,-5) and(-3,7) write an equation for the line in point slope form rewrite the equation in slope intercept form
Answers: 1
Mathematics, 21.06.2019 22:30, lilmaddy8856
Which expressions equal 9 when x=4 and y=1/3 a. x2+6y b. 2x + 3y c. y2-21x d. 5 (x/2) -3y e. 3x-9y
Answers: 2
Mathematics, 22.06.2019 00:00, normakite
The function y= x - 4x+ 5 approximates the height, y, of a bird, and its horizontal distance, x, as it flies from one fence post to another. all distances are in feet. complete the square to find and interpret the extreme value (vertex). select two answers: one extreme value and one interpretation.
Answers: 2
Do you know the correct answer?
Questions in other subjects:

English, 24.10.2020 04:10

Physics, 24.10.2020 04:10

Mathematics, 24.10.2020 04:10


