


=
The graph of f(x) = x2 is translated to form
g(x) = (x - 2)2 -3.
3
cu
1<...

Mathematics, 17.12.2021 01:20, Ezekielcassese
=
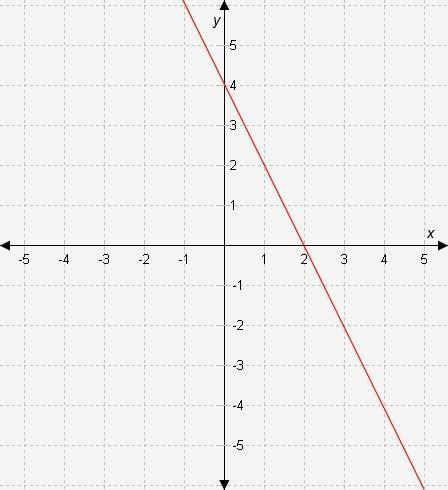
The graph of f(x) = x2 is translated to form
g(x) = (x - 2)2 -3.
3
cu
1
-5 -3 -2 -1
2
3
X
-24
1917
-4
-5
Which graph represents g(x)?

Answers: 3
Other questions on the subject: Mathematics
Mathematics, 21.06.2019 19:00, sreyasusanbinu
45% of the trees in a park are apple trees. there are 27 apple trees in the park. how many trees are in the park in all?
Answers: 1
Mathematics, 21.06.2019 19:30, MagicDragon4734
Which of the points a(6, 2), b(0, 0), c(3, 2), d(−12, 8), e(−12, −8) belong to the graph of direct variation y= 2/3 x?
Answers: 2
Do you know the correct answer?
Questions in other subjects:

Mathematics, 04.05.2020 22:36
Mathematics, 04.05.2020 22:36

Mathematics, 04.05.2020 22:36
English, 04.05.2020 22:36
Mathematics, 04.05.2020 22:36


