


The data reflects the distance traveled (x), paired with
time spent running (y).
How...

Mathematics, 16.12.2021 19:50, zelds63481
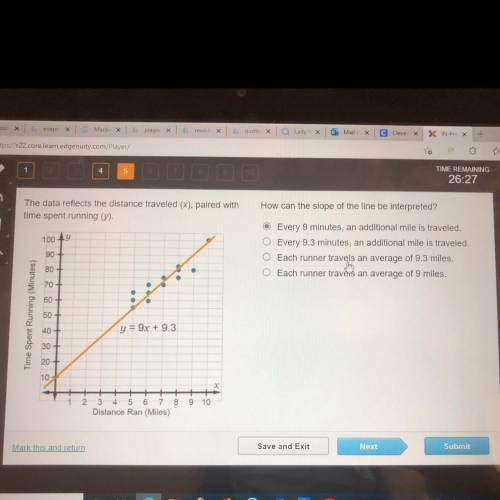
The data reflects the distance traveled (x), paired with
time spent running (y).
How can the slope of the line be interpreted?
Every 9 minutes, an additional mile is traveled
Every 9.3 minutes, an additional mile is traveled
Each runner travels an average of 9.3 miles.
Each runner travels an average of 9 miles

Answers: 1
Other questions on the subject: Mathematics
Mathematics, 21.06.2019 20:00, annieleblanc2004
Which type of graph would allow us to quickly see how many students between 100 and 200 students were treated?
Answers: 1
Mathematics, 21.06.2019 20:50, brea2006
An automobile assembly line operation has a scheduled mean completion time, μ, of 12 minutes. the standard deviation of completion times is 1.6 minutes. it is claimed that, under new management, the mean completion time has decreased. to test this claim, a random sample of 33 completion times under new management was taken. the sample had a mean of 11.2 minutes. assume that the population is normally distributed. can we support, at the 0.05 level of significance, the claim that the mean completion time has decreased under new management? assume that the standard deviation of completion times has not changed.
Answers: 3
Do you know the correct answer?
Questions in other subjects:


Social Studies, 22.12.2019 11:31

History, 22.12.2019 11:31


Health, 22.12.2019 11:31
History, 22.12.2019 11:31


