


20 points
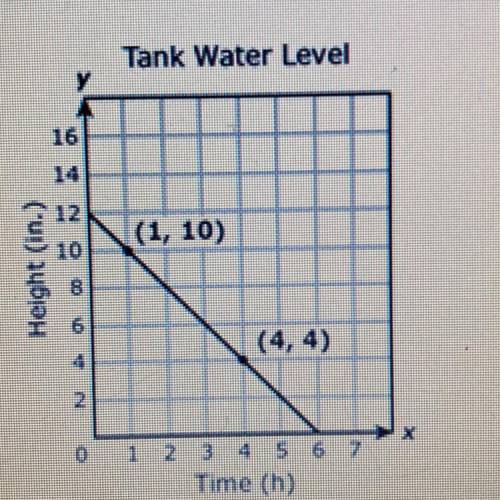
The graph below shows the water level in a tank being drained at a
constant rate....

Mathematics, 14.12.2021 08:30, rleiphart1
20 points
The graph below shows the water level in a tank being drained at a
constant rate. What does the X-intercept of the graph represent? *
Tank Water Level
у
16
14
12
(1, 10)
Height (in.)
(4,4)
4
2
0
1 2
3 4 5 6 7
Time (h)
The initial height of the water before any water drained out.
The number of hours it takes to completely empty the tank of water
The number of hours needed to drain 1 inch of water from the tank
The number of inches that the tank can hold

Answers: 3
Other questions on the subject: Mathematics
Mathematics, 21.06.2019 22:00, HistoryLee
You are standing next to a really big circular lake. you want to measure the diameter of the lake, but you don't want to have to swim across with a measuring tape! you decide to walk around the perimeter of the lake and measure its circumference, and find that it's 400\pi\text{ m}400? m. what is the diameter dd of the lake?
Answers: 3
Mathematics, 22.06.2019 00:30, bossefamily1
Use the irregular polygon below. show all work. a. find the perimeter. b. find the area. the angles of the irregular polygon is 2, 8, 8, and 4.
Answers: 2
Do you know the correct answer?
Questions in other subjects:
Mathematics, 03.06.2020 23:57
Mathematics, 03.06.2020 23:57


Health, 03.06.2020 23:57

English, 03.06.2020 23:57
Mathematics, 03.06.2020 23:57
Mathematics, 03.06.2020 23:57
Mathematics, 03.06.2020 23:57


