

Mathematics, 13.12.2021 07:10, aidenmanpig
POSSIBLE POINTS 33 33
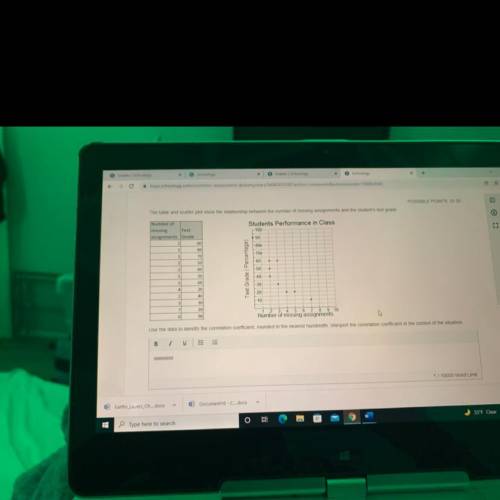
The table and scatter plot show the relationship between the number of missing assignments and the student's test grade
Students Performance in Class
100
90
-80-
-70
-60
Number of
missing
Test
assignments Grade
2
60
1
80
1
70
2 50
2
60
5
20
3
60
4
20
2
40
3 30
7
20
0
90
Test Grade (Percentage)
50
-40
30
20
10
1 3 4 5 6 7 8 10
Number of missing assignments
Use the data to identify the correlation coefficient, rounded to the nearest hundredth. Interpret the correlation coefficient in the context of the situation,
B
1
IC
iii
TII

Answers: 3


Other questions on the subject: Mathematics
Mathematics, 21.06.2019 19:20, Courtneymorris19
Which of the following is the result of expanding the series
Answers: 1
Mathematics, 21.06.2019 20:00, mharrington2934
What are the digits that repeat in the smallest sequence of repeating digits in the decimal equivalent of 24/11?
Answers: 1
Mathematics, 21.06.2019 21:30, Kizmit1423
How does reflecting or rotating a figure change the interior angles of the figure?
Answers: 2
Do you know the correct answer?
POSSIBLE POINTS 33 33
The table and scatter plot show the relationship between the number of missi...
Questions in other subjects:

Social Studies, 20.09.2020 19:01


English, 20.09.2020 19:01
Mathematics, 20.09.2020 19:01


