

Mathematics, 13.12.2021 05:50, aprilkenedy12
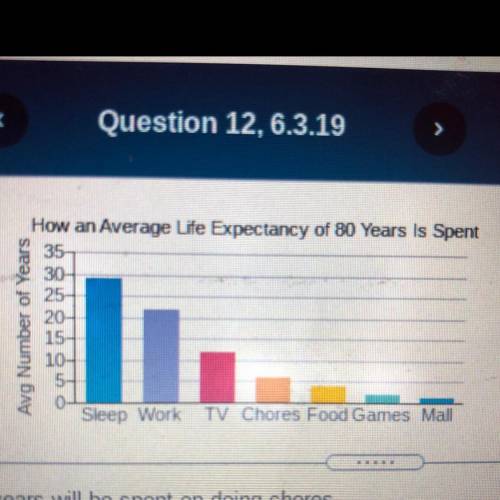
The bar graph shows the average number of years a group of people devoted to their most time-consuming activities. According to the graph, a person from this group will devote 35 years to sleeping and doing chores. The number of years sleeping will
exceed the number of years doing chores by 23. Over a lifetime, how many years will be spent on each of these activities?
_years on sleeping
_years on chores

Answers: 1


Other questions on the subject: Mathematics
Mathematics, 22.06.2019 01:00, mdegracia73
The actual length of side t is 0.045cm. use the scale drawing to find the actual side length of w
Answers: 1
Do you know the correct answer?
The bar graph shows the average number of years a group of people devoted to their most time-consumi...
Questions in other subjects:
Mathematics, 02.06.2021 03:30


Arts, 02.06.2021 03:30


Biology, 02.06.2021 03:30
Mathematics, 02.06.2021 03:30
Mathematics, 02.06.2021 03:30


