

Mathematics, 13.12.2021 05:30, adenmoye0910
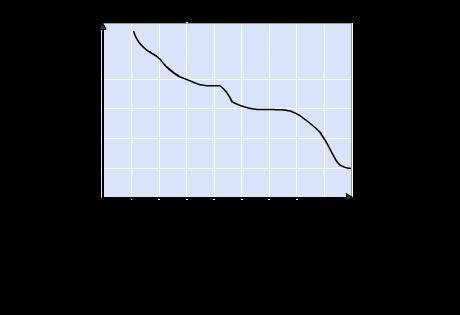
Which situation could this graph represent?
a. speed of a car starting from a stop sign and then approaching a stoplight
b. riding your bike slowly up a steep hill and then quickly down the other side
c. total rainfall during a rainy day
d. temperature as the weather changes from rainy to snowy

Answers: 3


Other questions on the subject: Mathematics
Mathematics, 22.06.2019 01:10, Weser17
Jobs and productivity! how do retail stores rate? one way to answer this question is to examine annual profits per employee. the following data give annual profits per employee (in units of 1 thousand dollars per employee) for companies in retail sales. assume σ ≈ 4.0 thousand dollars. 3.7 6.7 3.6 8.5 7.5 5.9 8.7 6.4 2.6 2.9 8.1 −1.9 11.9 8.2 6.4 4.7 5.5 4.8 3.0 4.3 −6.0 1.5 2.9 4.8 −1.7 9.4 5.5 5.8 4.7 6.2 15.0 4.1 3.7 5.1 4.2 (a) use a calculator or appropriate computer software to find x for the preceding data. (round your answer to two decimal places.) thousand dollars per employee (b) let us say that the preceding data are representative of the entire sector of retail sales companies. find an 80% confidence interval for μ, the average annual profit per employee for retail sales. (round your answers to two decimal places.) lower limit -- thousand dollars upper limit -- thousand dollars (c) let us say that you are the manager of a retail store with a large number of employees. suppose the annual profits are less than 3 thousand dollars per employee. do you think this might be low compared with other retail stores? explain by referring to the confidence interval you computed in part (b). yes. this confidence interval suggests that the profits per employee are less than those of other retail stores. no. this confidence interval suggests that the profits per employee do not differ from those of other retail stores. correct: your answer is correct. (d) suppose the annual profits are more than 6.5 thousand dollars per employee. as store manager, would you feel somewhat better? explain by referring to the confidence interval you computed in part (b). yes. this confidence interval suggests that the profits per employee are greater than those of other retail stores. no. this confidence interval suggests that the profits per employee do not differ from those of other retail stores. (e) find an 95% confidence interval for μ, the average annual profit per employee for retail sales. (round your answers to two decimal places.) lower limit 3.75 incorrect: your answer is incorrect. thousand dollars upper limit 6.41 incorrect: your answer is incorrect. thousand dollars
Answers: 3
Mathematics, 22.06.2019 01:10, andrejr0330jr
Farmers know that driving heavy equipment on wet soil compresses the soil and injures future crops. here are data on the "penetrability" of the same type of soil at two levels of compression. penetrability is a measure of how much resistance plant roots will meet when they try to grow through the soil. compressed soil 2.85 2.66 3 2.82 2.76 2.81 2.78 3.08 2.94 2.86 3.08 2.82 2.78 2.98 3.00 2.78 2.96 2.90 3.18 3.16 intermediate soil 3.17 3.37 3.1 3.40 3.38 3.14 3.18 3.26 2.96 3.02 3.54 3.36 3.18 3.12 3.86 2.92 3.46 3.44 3.62 4.26 use the data, omitting the high outlier, to give a 95% confidence interval for the decrease in penetrability of compressed soil relative to intermediate soil. compute degrees of freedom using the conservative method. interval: to
Answers: 1
Mathematics, 22.06.2019 02:30, mikayla843
Which of the following multiplication expressions can be modeled by the tiles shown? check all that apply. 8(3) = 24 6(4) = 24 (3)(12) = 36 24(3) = 72 3(8) = 24 2(12) = 24
Answers: 2
Do you know the correct answer?
Which situation could this graph represent?
a. speed of a car starting from a stop sign and then a...
Questions in other subjects:


Spanish, 06.05.2021 20:00

Health, 06.05.2021 20:00

Mathematics, 06.05.2021 20:00
English, 06.05.2021 20:00
Mathematics, 06.05.2021 20:00
Chemistry, 06.05.2021 20:00

Social Studies, 06.05.2021 20:00


