

Mathematics, 10.12.2021 18:50, naenaekennedybe
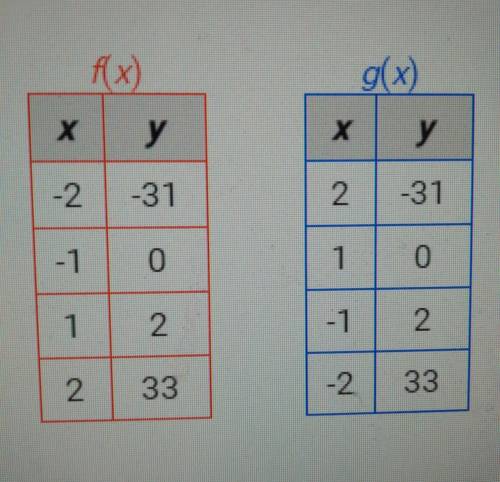
The x-values in the table for f(x) were multiplied by -1 to create the table for g(x). What is the relationship between the graphs of the two functions?
A. The graphs are not related.
B. They are reflections of each other across the y-axis.
c. They are reflections of each other across the x-axis.
D. They are reflections of each other over the line x = y.

Answers: 3


Other questions on the subject: Mathematics
Mathematics, 21.06.2019 19:30, shay03littletop5kx2p
Simplify (1/2)4th power a. (1/16) b.(1/8) c.(1/4)
Answers: 2
Mathematics, 21.06.2019 22:20, jimena15
As voters exit the polls, you ask a representative random sample of voters if they voted for a proposition. if the true percentage of voters who vote for the proposition is 63%, what is the probability that, in your sample, exactly 5 do not voted for the proposition before 2 voted for the proposition? the probability is
Answers: 2
Do you know the correct answer?
The x-values in the table for f(x) were multiplied by -1 to create the table for g(x). What is the r...
Questions in other subjects:

Social Studies, 23.09.2019 12:30


English, 23.09.2019 12:30

Biology, 23.09.2019 12:30


Chemistry, 23.09.2019 12:30


