

Mathematics, 10.12.2021 18:00, 25linm
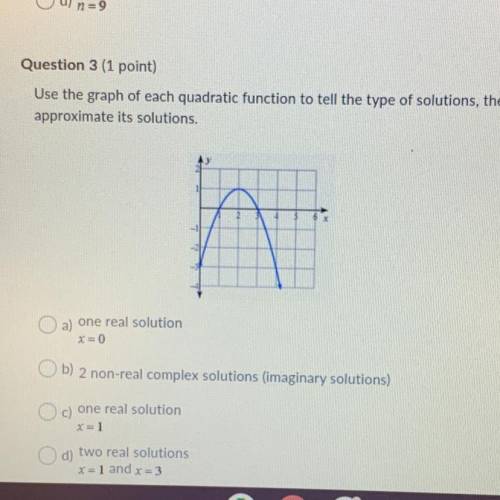
Use the graph of each quadratic function to tell the type of solutions, then
approximate its solutions.
a) one real solution
x=0
b) 2 non-real complex solutions (imaginary solutions)
c)
one real solution
X=1
d)
two real solutions
x = 1 and x = 3

Answers: 2


Other questions on the subject: Mathematics
Mathematics, 21.06.2019 20:30, jmcd10
Create a question with this scenario you could ask that could be answered only by graphing or using logarithm. david estimated he had about 20 fish in his pond. a year later, there were about 1.5 times as many fish. the year after that, the number of fish increased by a factor of 1.5 again. the number of fish is modeled by f(x)=20(1.5)^x.
Answers: 1
Mathematics, 22.06.2019 00:30, citlalli30
Candice uses the function f(t)=t+100−−−−−−√ to model the number of students in her after-school program. the variable t represents days and f(t) represents the number of students. how many days does it take for there to be 15 students in her program? a. 225 days b. 125 days c. 325 days d. 115 days
Answers: 2
Do you know the correct answer?
Use the graph of each quadratic function to tell the type of solutions, then
approximate its solut...
Questions in other subjects:
Mathematics, 19.07.2019 15:30

History, 19.07.2019 15:30

Health, 19.07.2019 15:30
Mathematics, 19.07.2019 15:30
History, 19.07.2019 15:30


