

Mathematics, 05.12.2021 06:30, nina2323
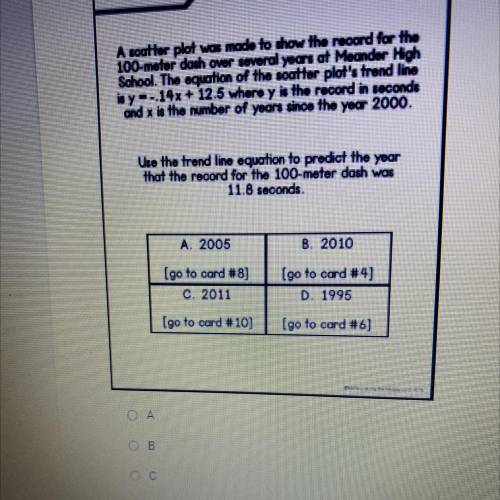
A scatter plot was made to show the record for the
100-meter dash over several years at Meander High
School. The equation of the scatter plot's trend line
is y = - 14x + 12.5 where y is the record in seconds
and x is the number of years since the year 2000.
Use the trend line equation to predict the year
that the record for the 100-meter dash was
11 8 seconds
A 2005
B. 2010
[go to card #8]
C. 2011
[go to card #4]
D. 1995
[go to card #10]
[go to card #6]

Answers: 1


Other questions on the subject: Mathematics
Mathematics, 21.06.2019 21:10, halimomohamed
If f(x) = 6x – 4, what is f(x) when x = 8? a2 b16 c44 d52
Answers: 2
Mathematics, 21.06.2019 23:50, tatibean26
The functions f(x) and g(x) are shown in the graph f(x)=x^2 what is g(x) ?
Answers: 2
Mathematics, 22.06.2019 00:00, camila9022
Tatiana reads 40 pages of her book every night for x number of nights. write an expression that shows the number of pages she has read
Answers: 3
Do you know the correct answer?
A scatter plot was made to show the record for the
100-meter dash over several years at Meander Hi...
Questions in other subjects:

Biology, 17.09.2019 22:00

Social Studies, 17.09.2019 22:00

English, 17.09.2019 22:00

Mathematics, 17.09.2019 22:00
English, 17.09.2019 22:00
Biology, 17.09.2019 22:00


