

Mathematics, 05.12.2021 03:40, porkhappycom
Analyzing Univariate Data
In this activity, you will compare the mean, median, interquartile range, and standard deviation of two sets of data and
interpret them.
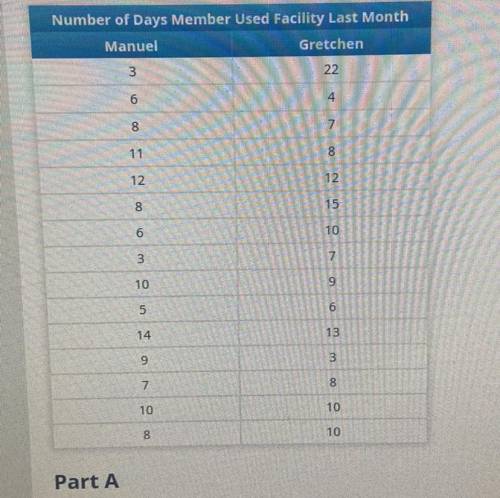
The members of a rock climbing club can use an indoor rock climbing facility anytime they wish as part of their club
membership. As it creates a new budget, the club decides to investigate how often the members use the indoor climbing
facility. Then it will decide whether to increase the budget for this facility. Manuel and Gretchen are in charge of gathering this information, so they survey the members of the club. Each person will administer the survey to 15 randomly selected
members and record how many days in the past month those members used the indoor facility. Their data is shown in the
table.
Use the graphing tool to create a histogram of Gretchen’s data. Use eight bins for your histogram.

Answers: 2


Other questions on the subject: Mathematics
Mathematics, 21.06.2019 18:30, 420420blazee
You were told that the amount of time lapsed between consecutive trades on the new york stock exchange followed a normal distribution with a mean of 15 seconds. you were also told that the probability that the time lapsed between two consecutive trades to fall between 16 to 17 seconds was 13%. the probability that the time lapsed between two consecutive trades would fall below 13 seconds was 7%. what is the probability that the time lapsed between two consecutive trades will be between 14 and 15 seconds?
Answers: 3
Mathematics, 21.06.2019 19:10, brownzackery71
Girardo is using the model below to solve the equation . girardo uses the following steps: step 1 add 4 negative x-tiles to both sides step 2 add 1 negative unit tile to both sides step 3 the solution is which step could be adjusted so that gerardo's final step results in a positive x-value? in step 1, he should have added 4 positive x-tiles to both sides. in step 1, he should have added 3 negative x-tiles to both sides. in step 2, he should have added 4 negative unit tiles to both sides. in step 2, he should have added 1 positive unit tile to both sides.
Answers: 2
Mathematics, 21.06.2019 21:40, Casey7019
Asystem of linear equations contains two equations with the same slope. select all of the correct statements. i a. the system may have two solutions. - b. the system may have infinitely many solutions. c. the system may have one solution. o d. the system may have no solution. submit
Answers: 3
Do you know the correct answer?
Analyzing Univariate Data
In this activity, you will compare the mean, median, interquartile range...
Questions in other subjects:

Engineering, 22.10.2020 21:01
Mathematics, 22.10.2020 21:01

Chemistry, 22.10.2020 21:01

Mathematics, 22.10.2020 21:01


Biology, 22.10.2020 21:01


